Fig. 4
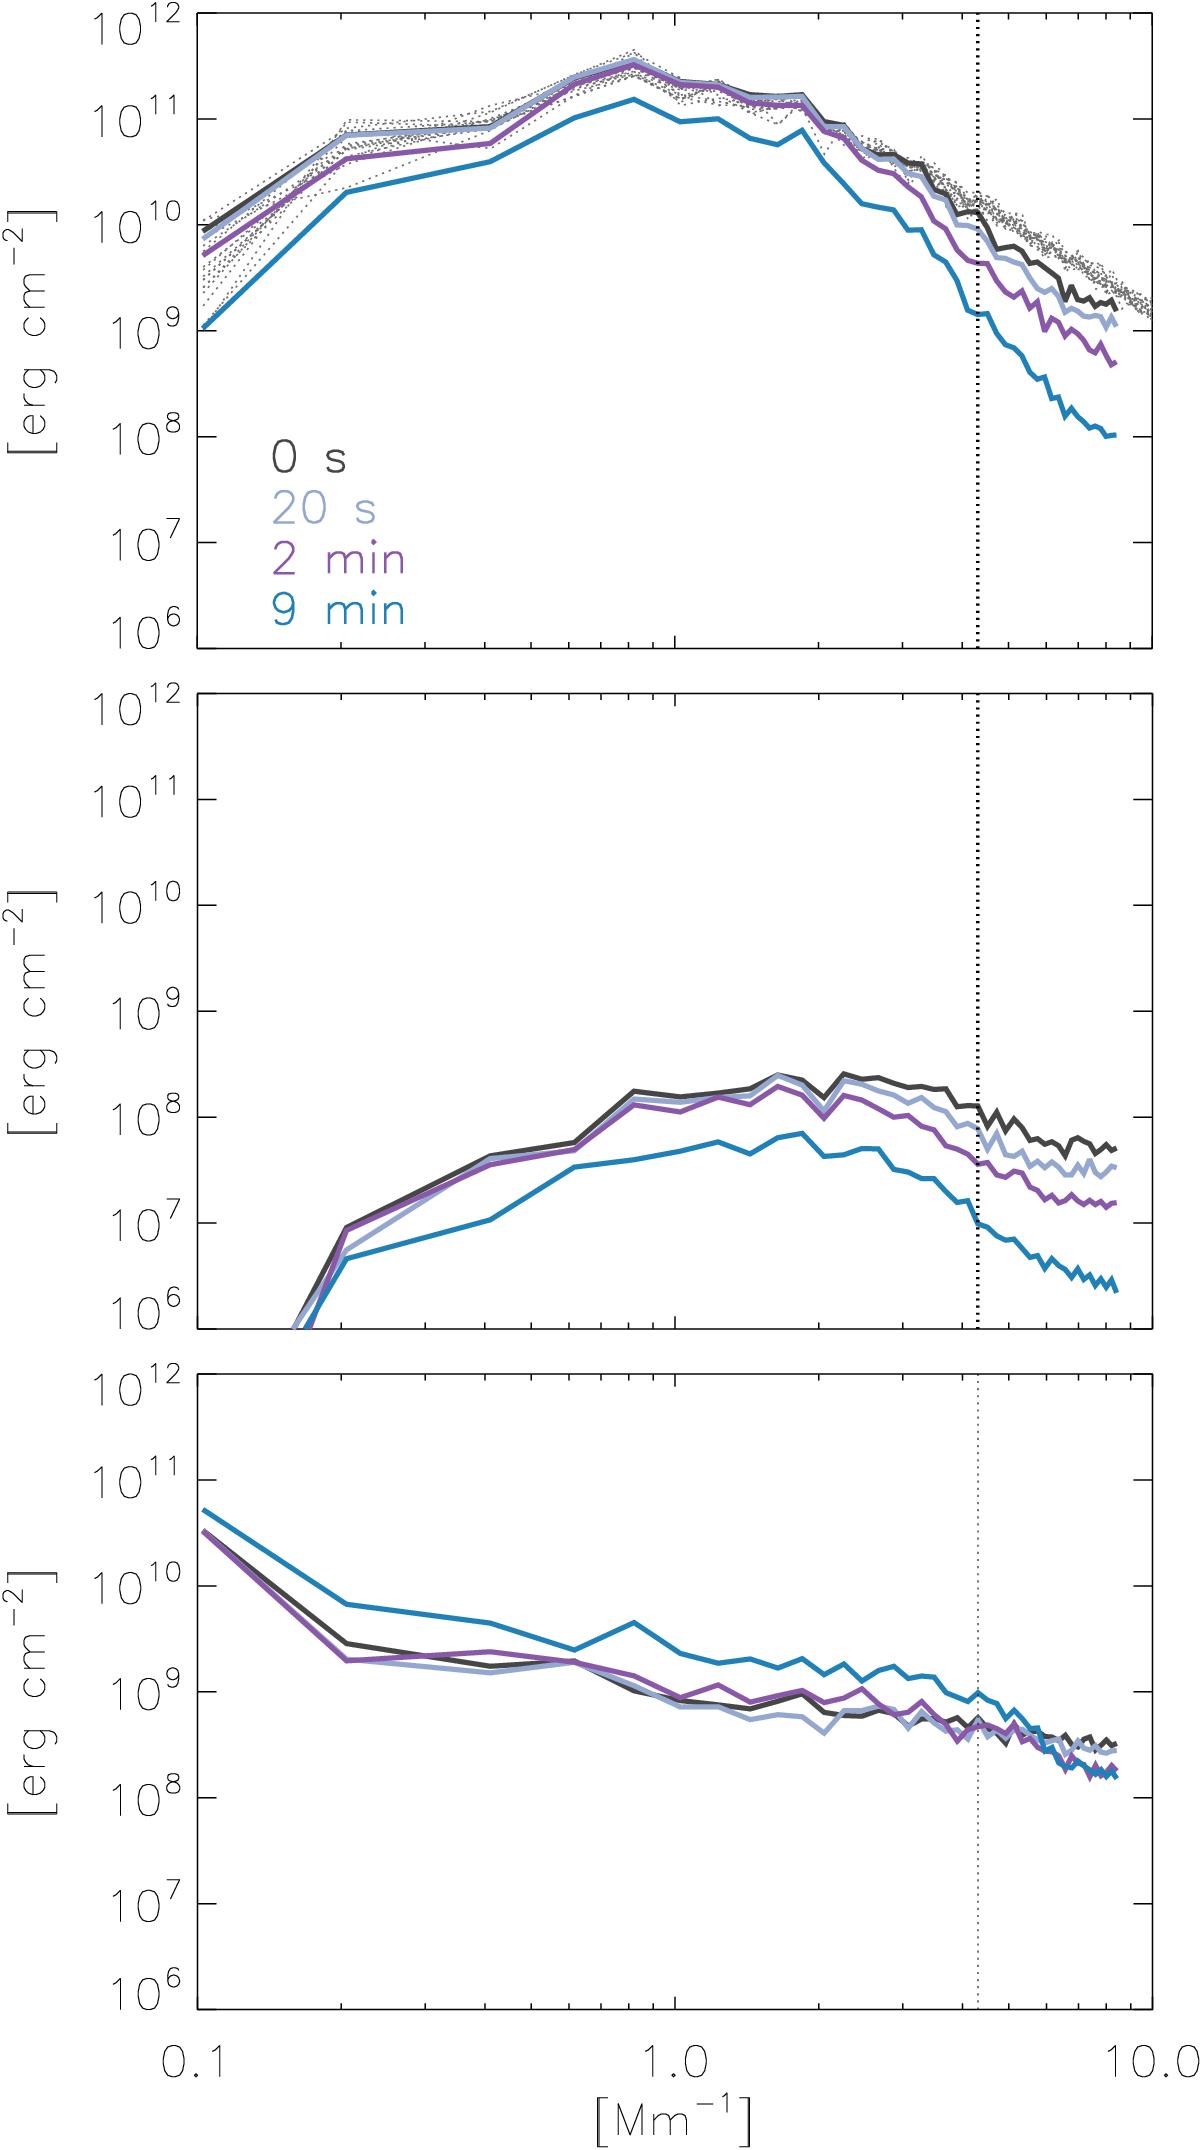
Sim 1: influence of temporal averaging on the power spectra of the vertical component of kinetic (top panel) and magnetic energy (middle panel) and power spectra of the total magnetic energy (bottom panel). Different colors indidcate the power spectra obtained after integration over 0 s, 20 s, 2 min, and 9 min as denoted in the legend.
Current usage metrics show cumulative count of Article Views (full-text article views including HTML views, PDF and ePub downloads, according to the available data) and Abstracts Views on Vision4Press platform.
Data correspond to usage on the plateform after 2015. The current usage metrics is available 48-96 hours after online publication and is updated daily on week days.
Initial download of the metrics may take a while.