Fig. 2
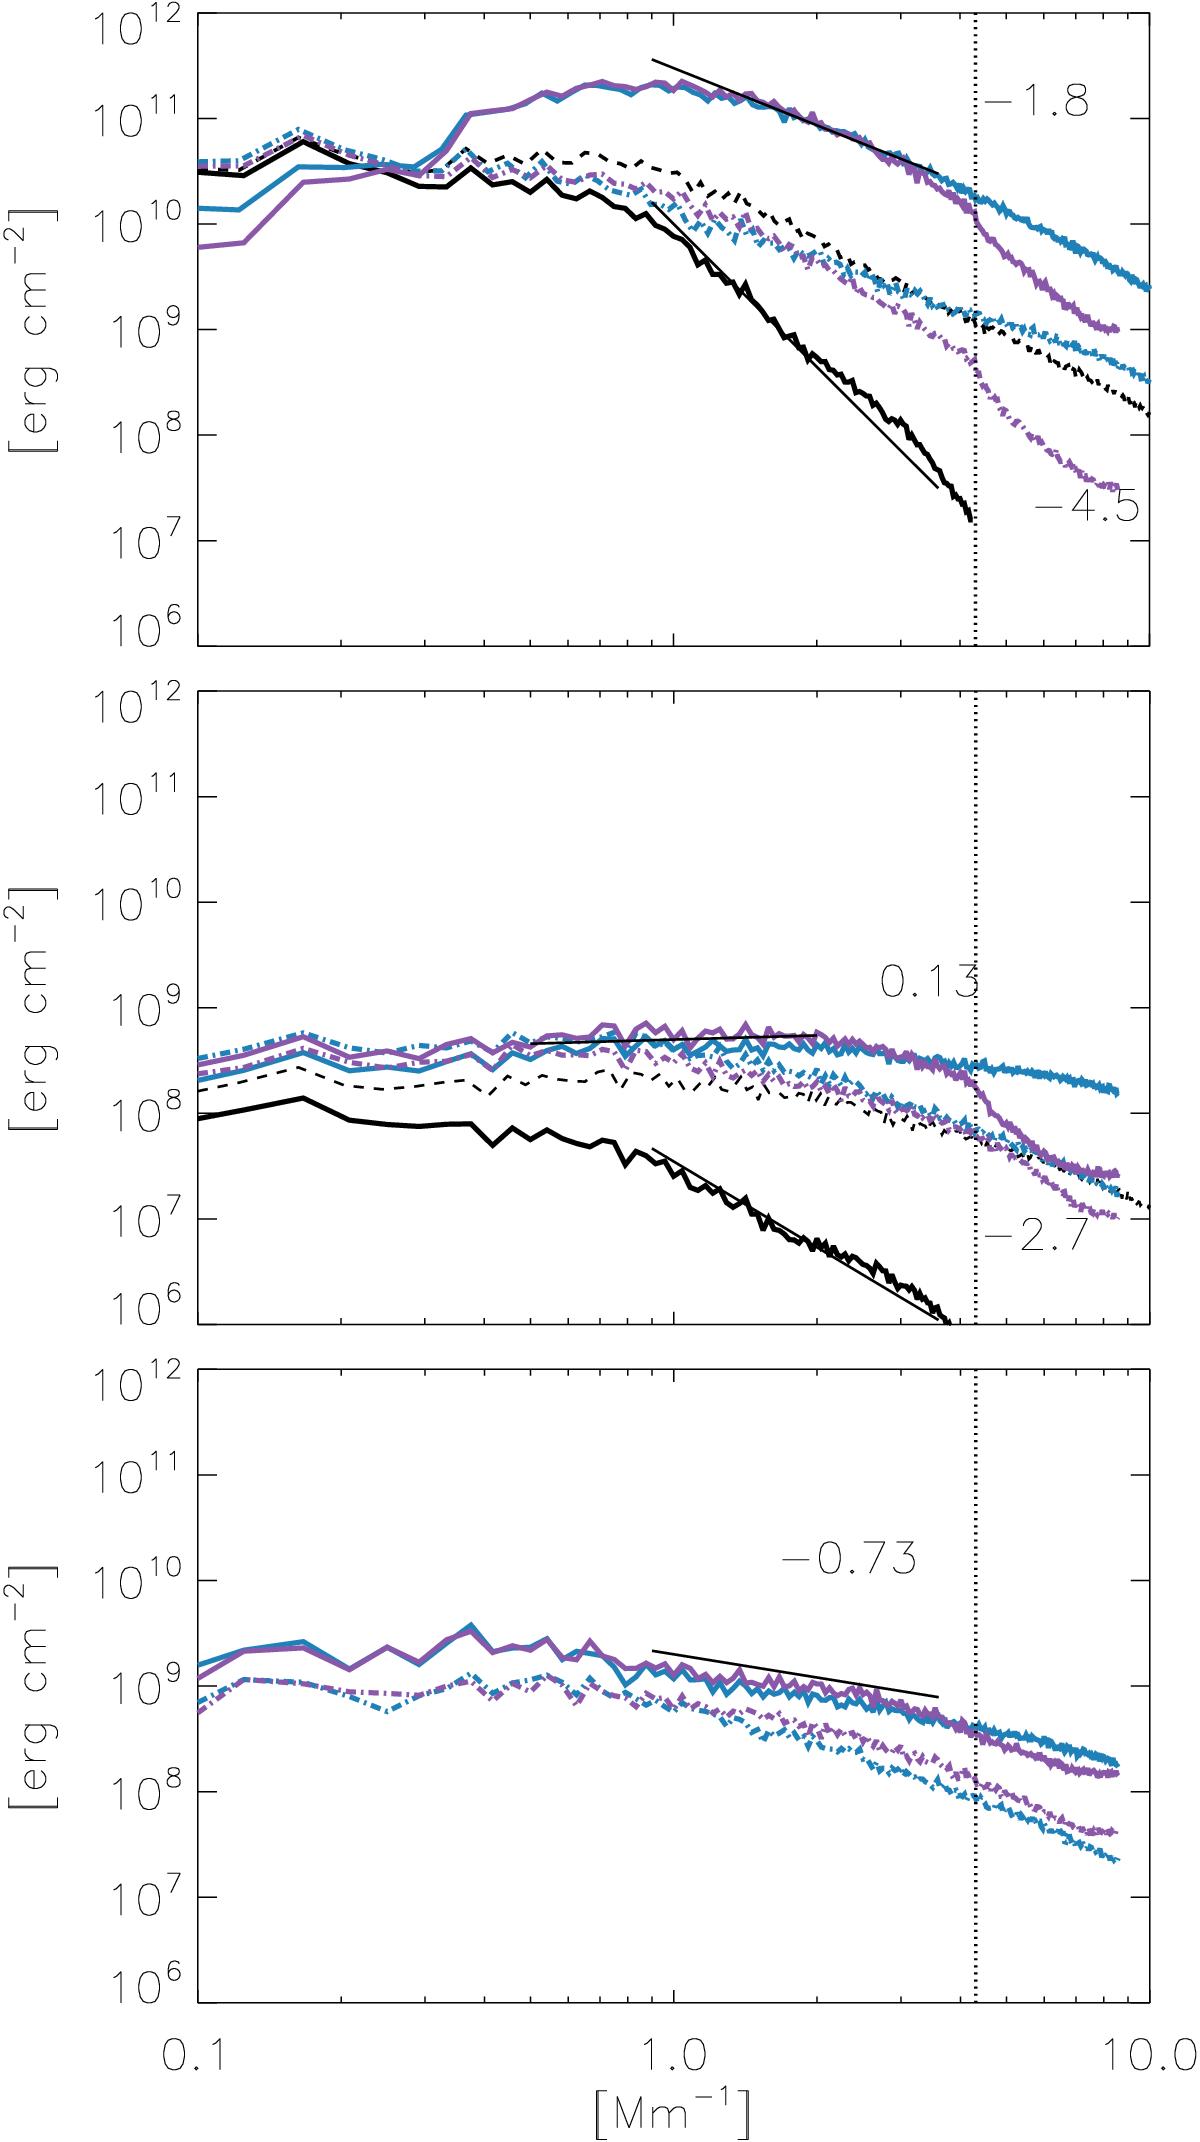
Sim 2: power spectra of the vertical component of kinetic (top panel) and magnetic energy (middle panel) and power spectra of the total magnetic energy (bottom panel). Blue lines indicate the original spectra before any spatial smearing at different heights (log τ = 0 solid and −2.0 dashed). Purple lines show the result of 2D inversions at the same optical depths. Black lines indicate spectra of the corresponding parameters obtained from Solarsoft routines (see the text) before (dashed line) and after (solid line) spatial smearing. Vertical line represent the resolution limit of Hinode/SP.
Current usage metrics show cumulative count of Article Views (full-text article views including HTML views, PDF and ePub downloads, according to the available data) and Abstracts Views on Vision4Press platform.
Data correspond to usage on the plateform after 2015. The current usage metrics is available 48-96 hours after online publication and is updated daily on week days.
Initial download of the metrics may take a while.