Free Access
Fig. 1
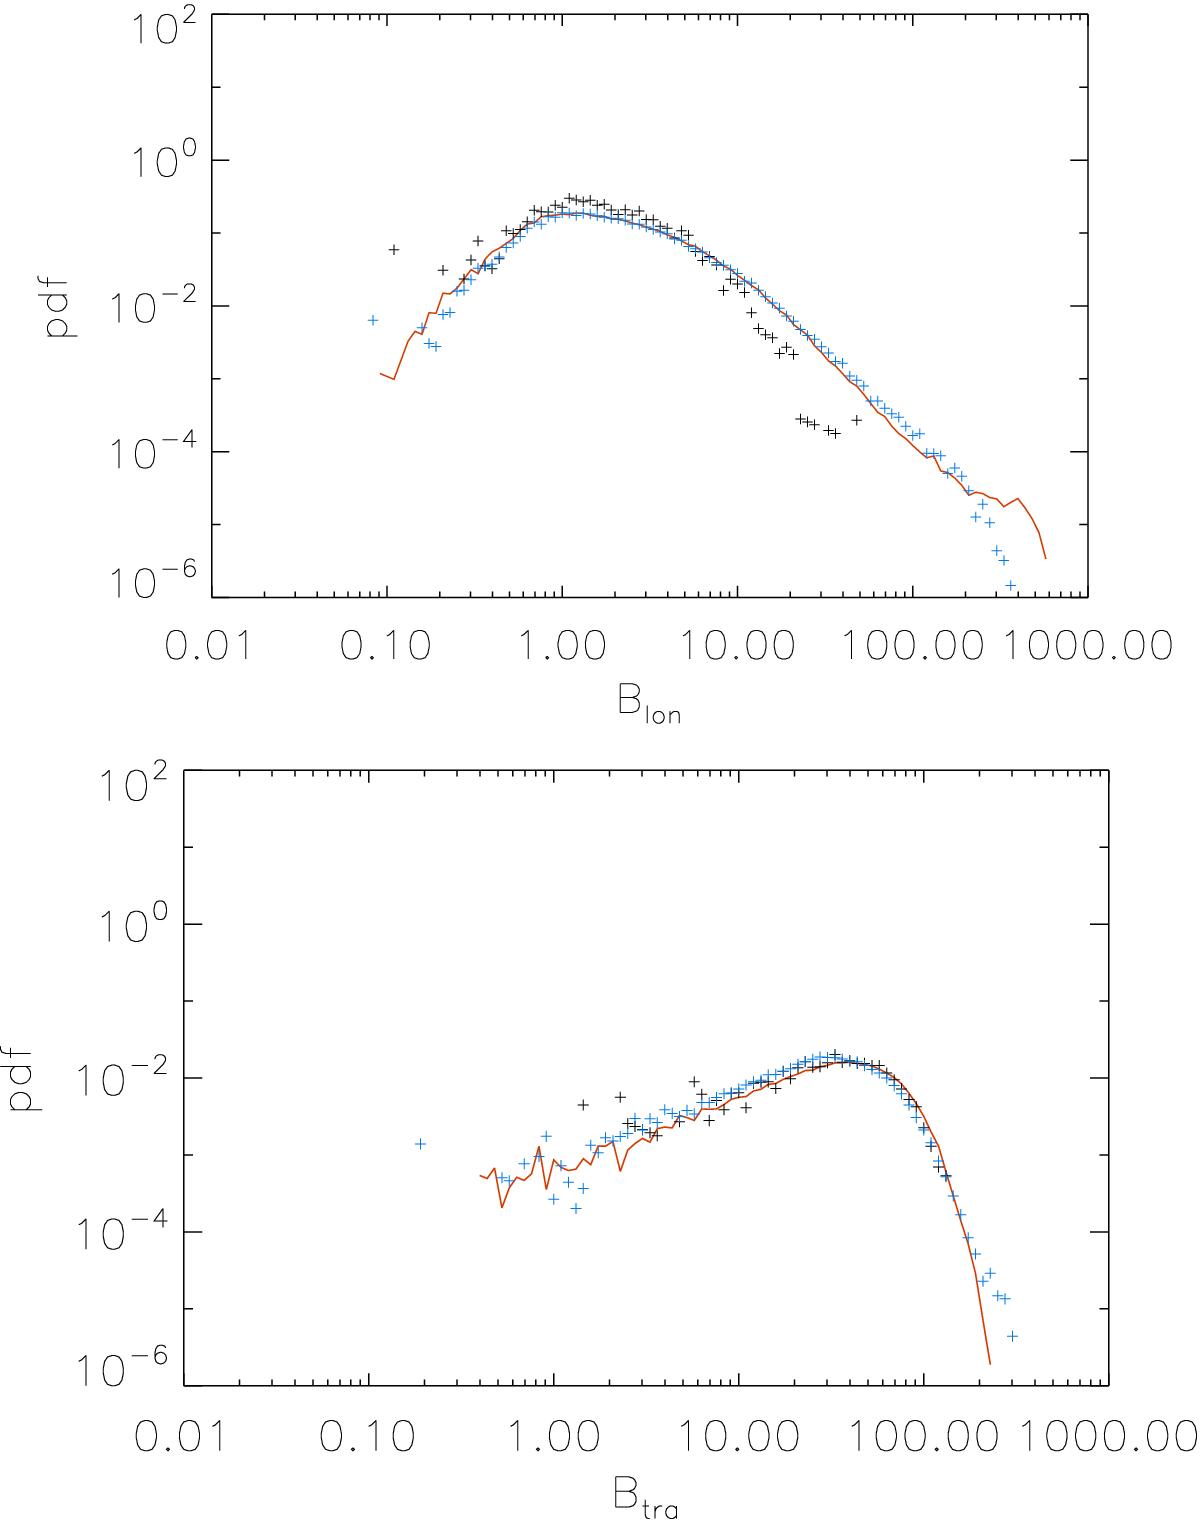
Probability density functions (PDFs) for the longitudinal (upper panel) and transverse (lower panel) apparent magnetic flux density. PDFs from MHD simulations reduced to Hinode resolution (Sim1: black plus signs and Sim2: blue plus signs) are compared with the PDFs obtained from observations (red solid line).
This figure is made of several images, please see below:
Current usage metrics show cumulative count of Article Views (full-text article views including HTML views, PDF and ePub downloads, according to the available data) and Abstracts Views on Vision4Press platform.
Data correspond to usage on the plateform after 2015. The current usage metrics is available 48-96 hours after online publication and is updated daily on week days.
Initial download of the metrics may take a while.