Fig. 3
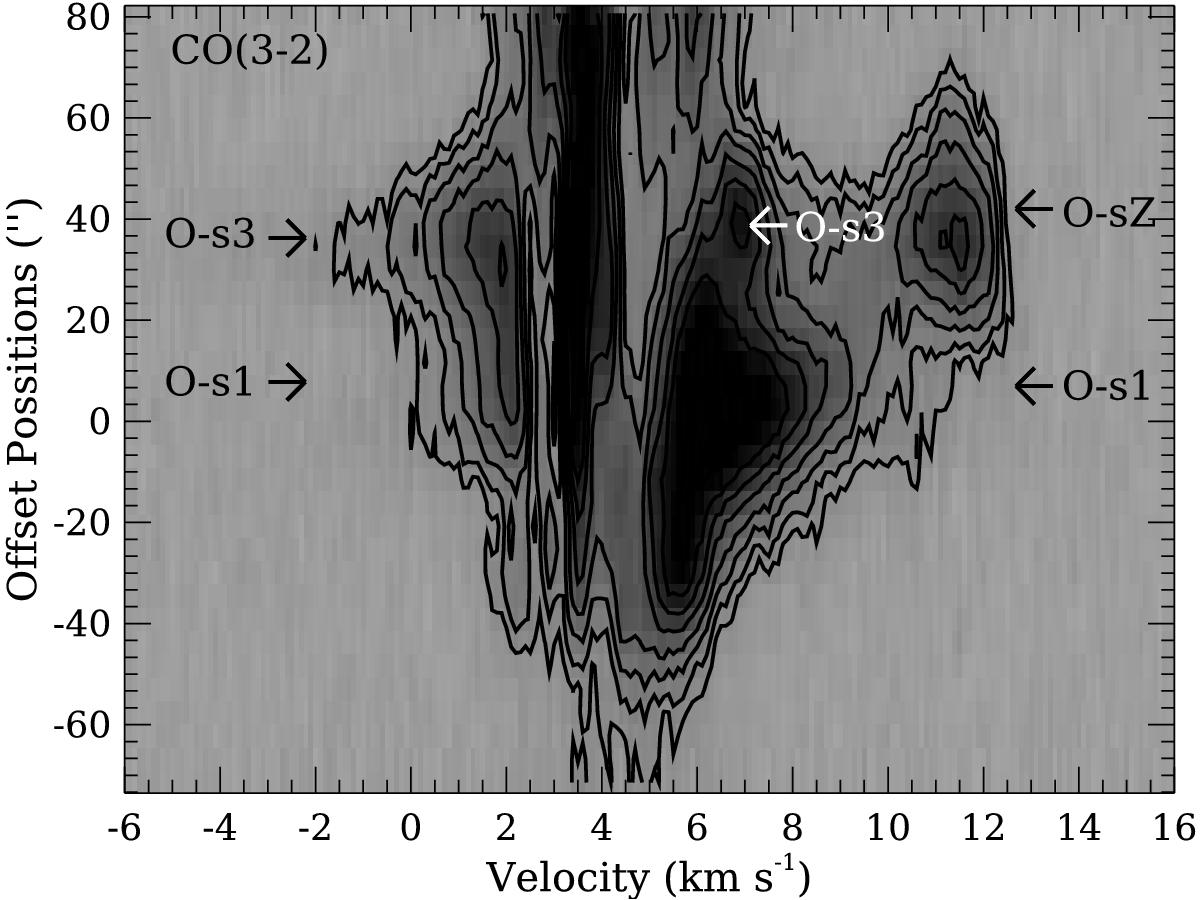
Position-velocity diagrams of the 12CO(3 − 2) molecular emission along a line from the northeast to southwest direction through the sources 1 and 3. Contour levels correspond to 1.5, 2.3, 3.5, 5.0, 7.0, 9.0, 11.0, and 14.0 K. Emissions labeled as O-s1 and O-s3 would be the redshifted and blueshifted lobes associated with sources 1 and 3, respectively.
Current usage metrics show cumulative count of Article Views (full-text article views including HTML views, PDF and ePub downloads, according to the available data) and Abstracts Views on Vision4Press platform.
Data correspond to usage on the plateform after 2015. The current usage metrics is available 48-96 hours after online publication and is updated daily on week days.
Initial download of the metrics may take a while.