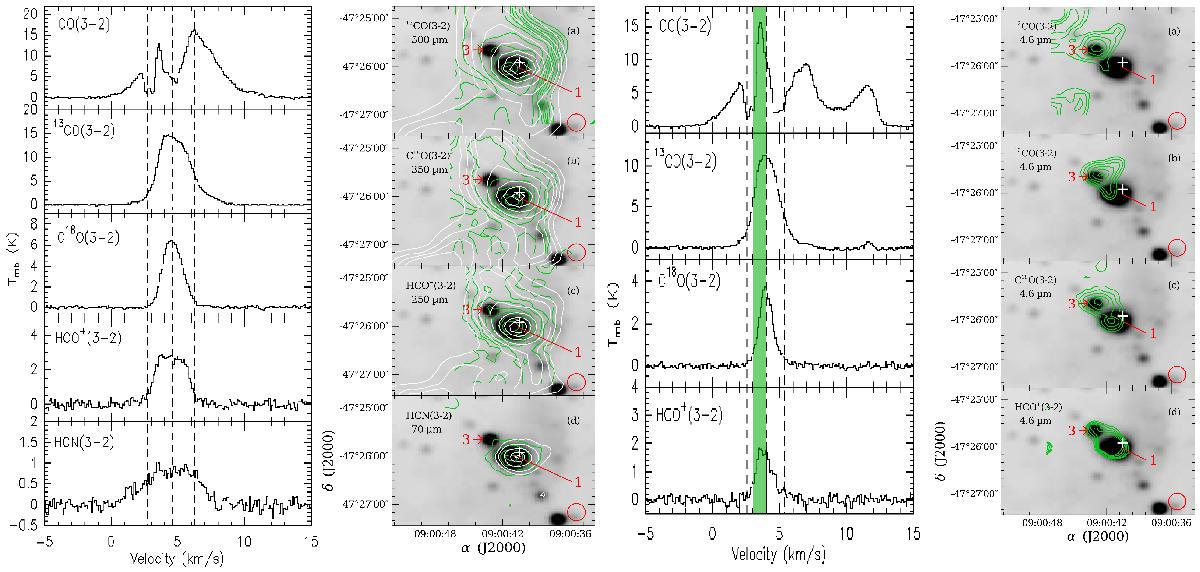
Fig. 2

Left panels: molecular line profiles of 12CO, 13CO, C18O, HCO+, and HCN toward source 1. The vertical dashed central line corresponds to +4.6 km s-1. The two remaining vertical dashed lines indicate the velocity range [+2.7, +6.3] km s-1. Integrated emission maps for the observed molecules (green contours) superposed over the 4.6 μm (grayscale) image. The range of the integrated emission for all molecules is [+2.7,+6.3] km s-1. The contour levels of the 13CO are between 4 and 47 K km s-1. The contour levels of C18O have values between 1.9 and 13.2 K km s-1, while the contours of HCO+ and HCN are between 0.8−7.8 K km s-1 and 1.1−4.1 K km s-1, respectively. Herschel maps at 500 a), 350 b), 250 c), and 70 μm d) are superimposed in white contours. The white cross indicates the IRAS source position, and the red arrows indicate the location of the identified sources. The HPBW is shown in the lower right corner of each panel. Right panels: molecular line profiles toward source 3. The vertical dashed central line corresponds to +4.0 km s-1. Integrated emission maps of the observed molecules (green contours) superposed onto the 4.6 μm (grayscale) image. The integration range for all molecules is [+3.0, +4.0] km s-1. The velocity range is indicated by the green bar. The contour levels of the CO are between 6.4 and 8.0 K km s-1. The contours levels of 13CO have values between 4.5 and 6.5 K km s-1, while the contours of C18O and HCO+ are between 1.2−2.3 K km s-1 and 0.7−1.1 K km s-1, respectively.
Current usage metrics show cumulative count of Article Views (full-text article views including HTML views, PDF and ePub downloads, according to the available data) and Abstracts Views on Vision4Press platform.
Data correspond to usage on the plateform after 2015. The current usage metrics is available 48-96 hours after online publication and is updated daily on week days.
Initial download of the metrics may take a while.


