Free Access
Fig. 7
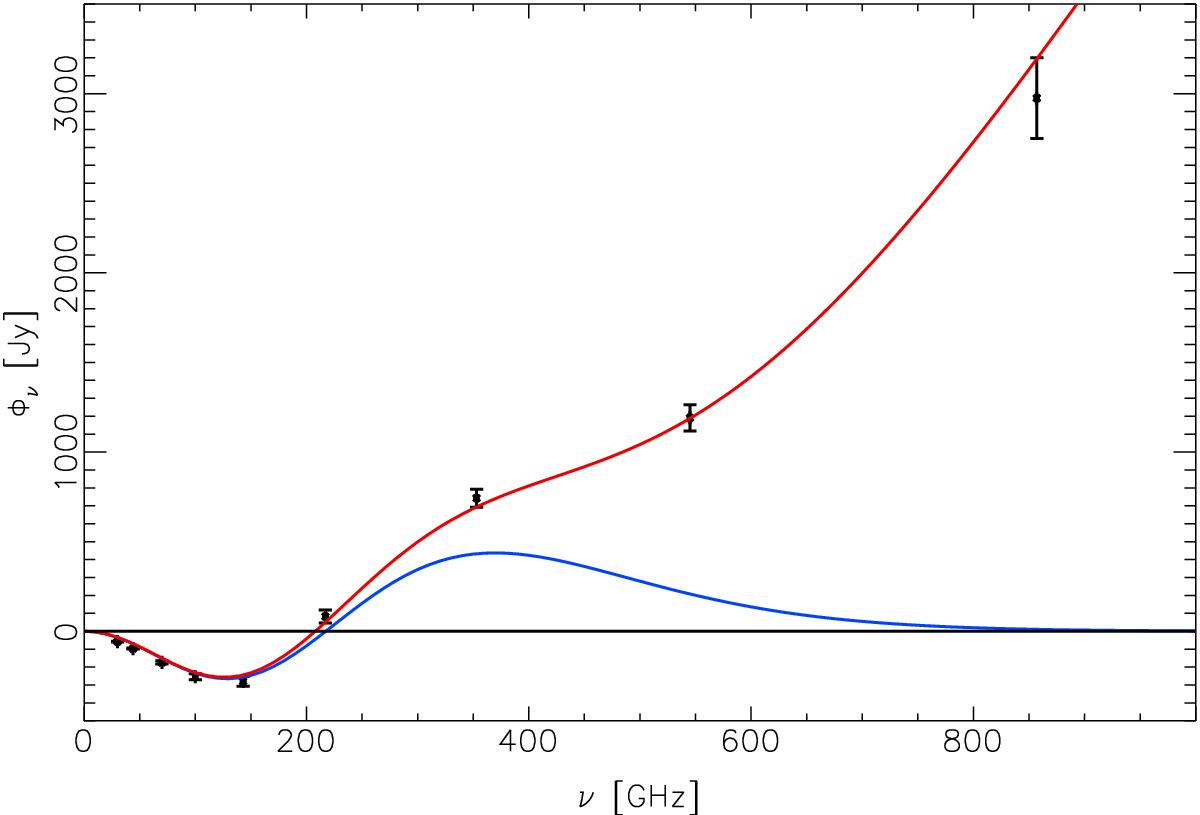
Observed SED of the stacked signal towards galaxy clusters, from 30 to 857 GHz. In blue we show the tSZ contribution to the total SED and in red the total SED considering both tSZ and infrared emissions.
Current usage metrics show cumulative count of Article Views (full-text article views including HTML views, PDF and ePub downloads, according to the available data) and Abstracts Views on Vision4Press platform.
Data correspond to usage on the plateform after 2015. The current usage metrics is available 48-96 hours after online publication and is updated daily on week days.
Initial download of the metrics may take a while.