Fig. 5
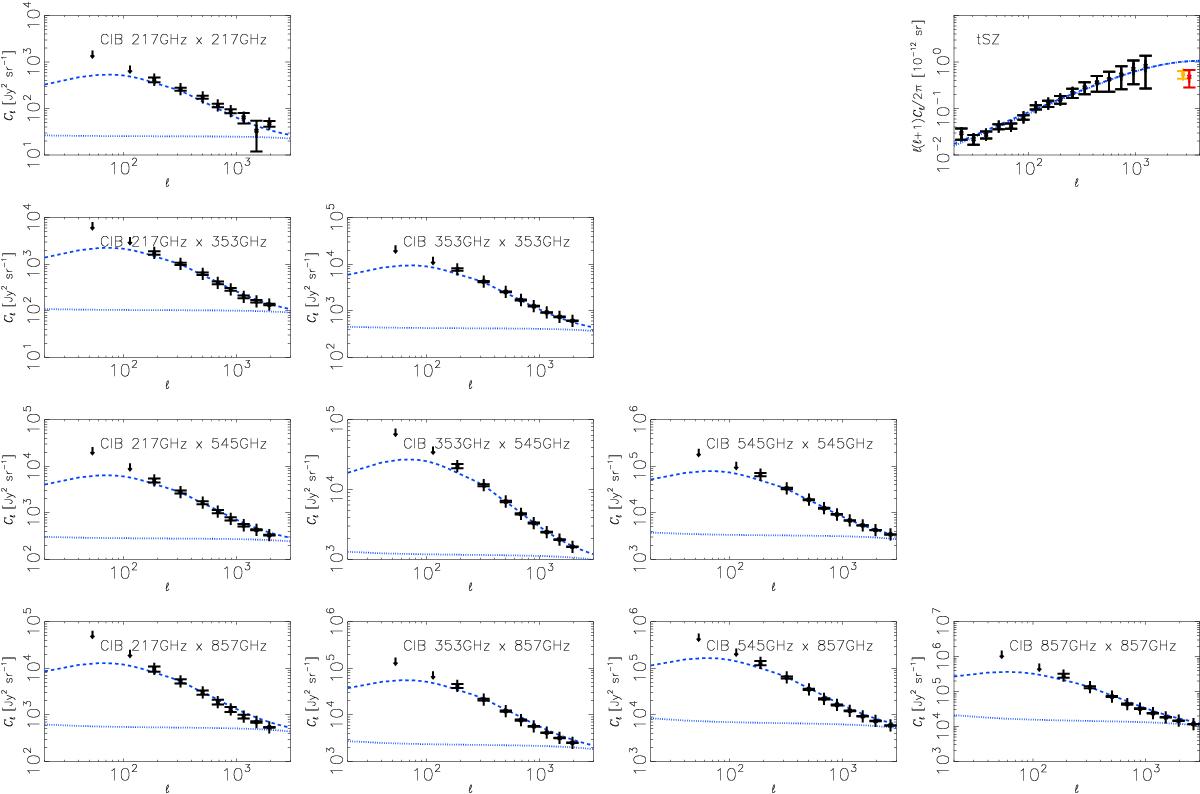
Upper right panel: observed tSZ power spectrum: Planck data from Planck Collaboration XXI (2014; black symbols), ACT data Reichardt et al. (2012; red symbols), and SPT data Sievers et al. (2013; orange symbols); with our fiducial model (dashed blue line). Other panels: observed CIB power spectra, with Planck data from Planck Collaboration XXX (2014; black) and our fiducial model (dashed blue line). These panels show auto- and cross-power spectra at 217, 353, 545, and 857 GHz. The dotted blue lines show the 1-halo plus shot-noise term for our fiducial model.
Current usage metrics show cumulative count of Article Views (full-text article views including HTML views, PDF and ePub downloads, according to the available data) and Abstracts Views on Vision4Press platform.
Data correspond to usage on the plateform after 2015. The current usage metrics is available 48-96 hours after online publication and is updated daily on week days.
Initial download of the metrics may take a while.