Fig. 3
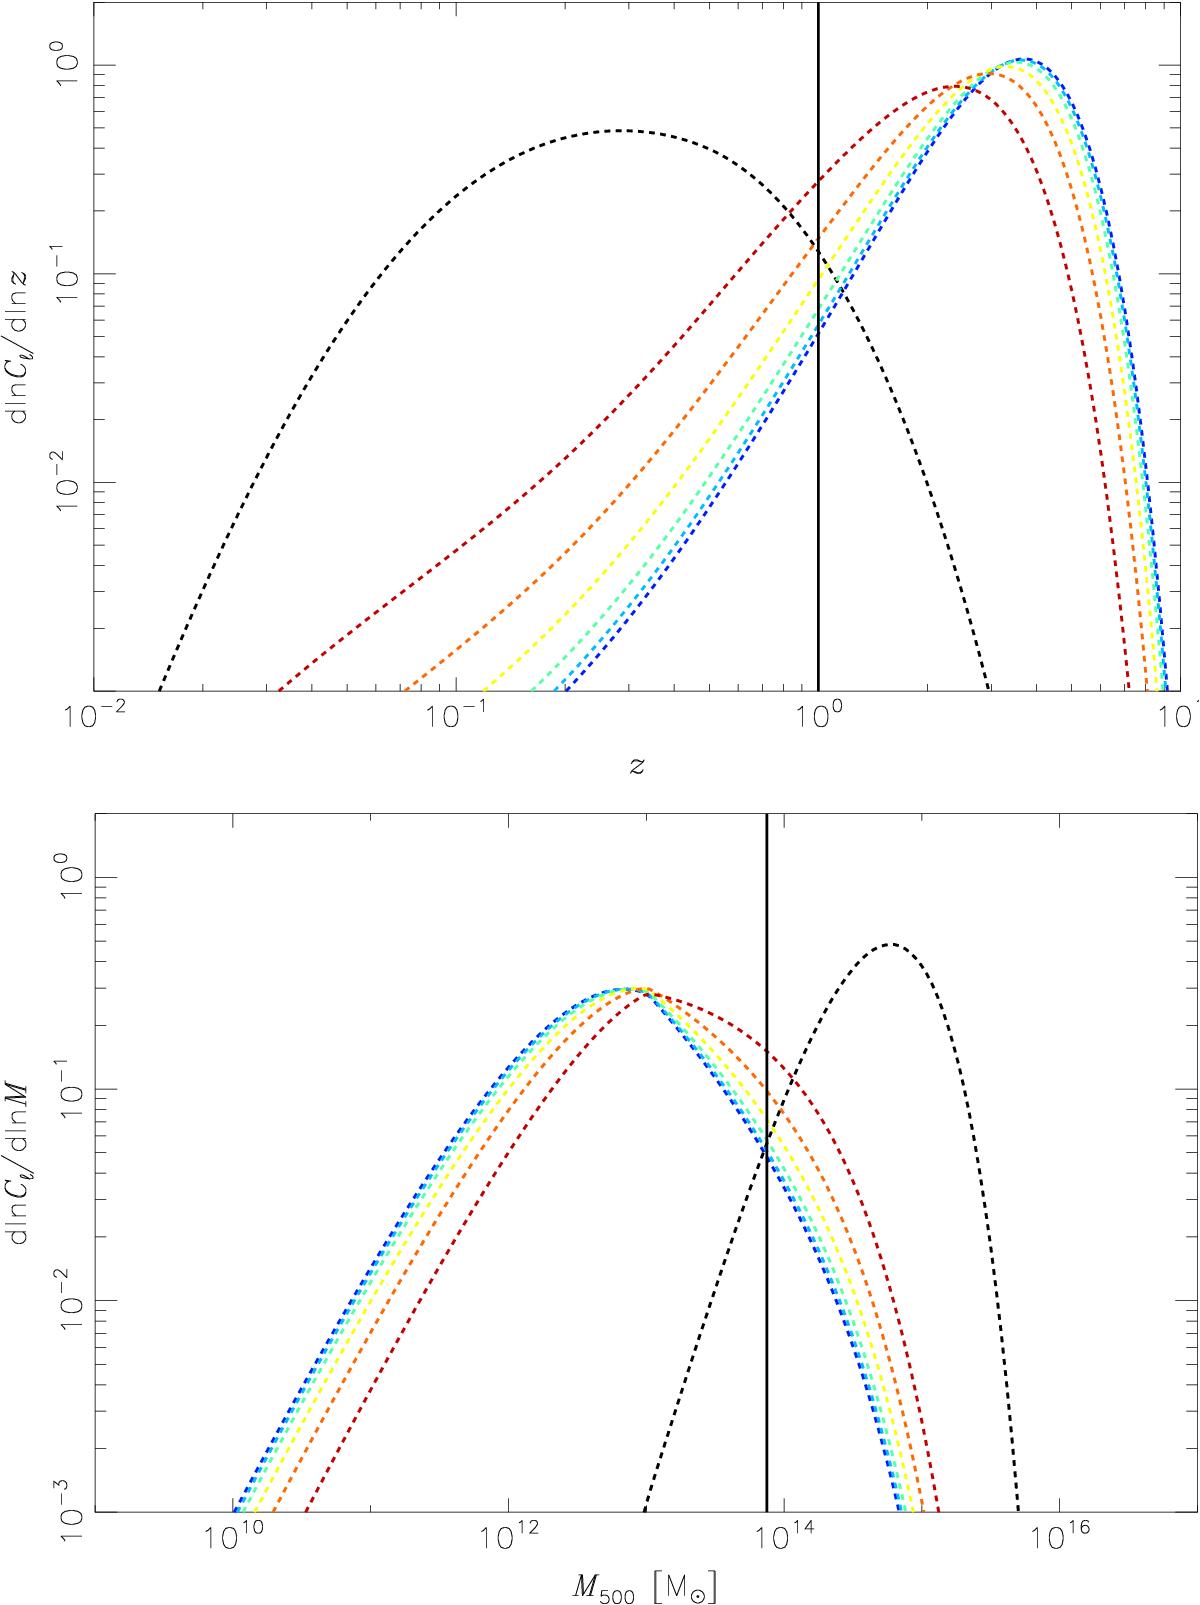
Top: predicted distribution of the tSZ and CIB power as a function of the redshift at ℓ = 1000. Bottom: predicted distribution of the tSZ and CIB power as a function of the host halo mass at ℓ = 1000. The black dashed line is for the tSZ effect, while the dark blue, light blue, green, yellow, orange, and red dashed lines are for CIB at 100, 143, 217, 353, 545, and 857 GHz respectively. The vertical solid black line shows the maximum redshift in PSZ2 (top panel) and the minimal M500 in PSZ2 (bottom panel).
Current usage metrics show cumulative count of Article Views (full-text article views including HTML views, PDF and ePub downloads, according to the available data) and Abstracts Views on Vision4Press platform.
Data correspond to usage on the plateform after 2015. The current usage metrics is available 48-96 hours after online publication and is updated daily on week days.
Initial download of the metrics may take a while.