Fig. 15
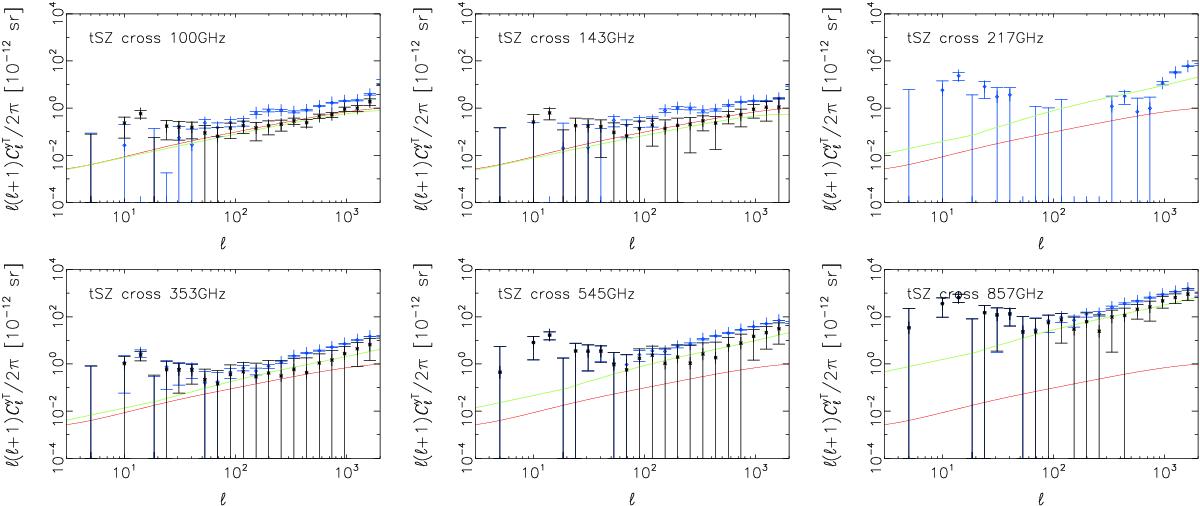
From left to right and top to bottom: observed cross-correlation between the MILCA y-map and the Planck frequency maps from 30 to 857 GHz. In blue are the data points, in black the CIB-cleaned data points; the red solid line is the predicted signal from tSZ only and the green line is the total expected signal from the tSZ signal and the tSZ-CIB correlation. All spectra are presented in Compton-parameter units.
Current usage metrics show cumulative count of Article Views (full-text article views including HTML views, PDF and ePub downloads, according to the available data) and Abstracts Views on Vision4Press platform.
Data correspond to usage on the plateform after 2015. The current usage metrics is available 48-96 hours after online publication and is updated daily on week days.
Initial download of the metrics may take a while.