Free Access
Fig. 14
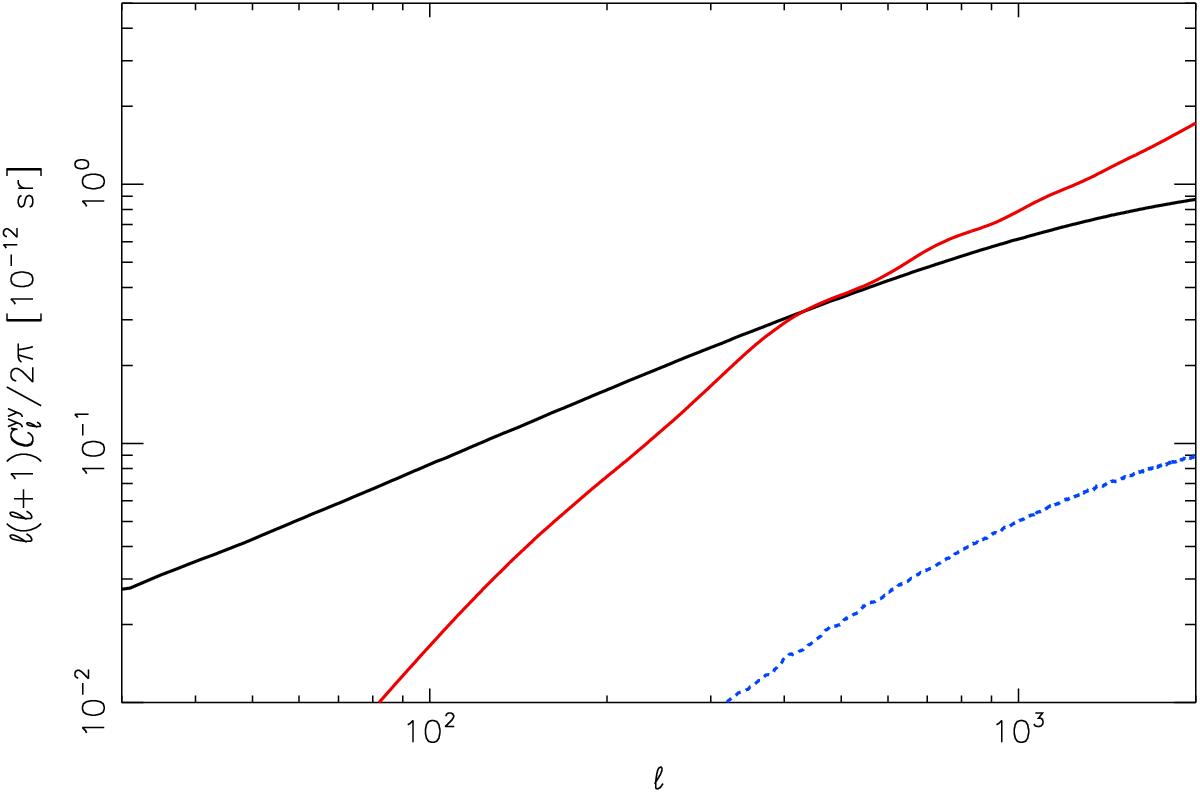
Expected contribution to the tSZ power spectrum for the true tSZ signal (black curve), for CIB leakage (red curve), and for tSZ-CIB leakage contribution (blue curve). The dotted line indicates a negative power spectrum.
Current usage metrics show cumulative count of Article Views (full-text article views including HTML views, PDF and ePub downloads, according to the available data) and Abstracts Views on Vision4Press platform.
Data correspond to usage on the plateform after 2015. The current usage metrics is available 48-96 hours after online publication and is updated daily on week days.
Initial download of the metrics may take a while.