Fig. 12
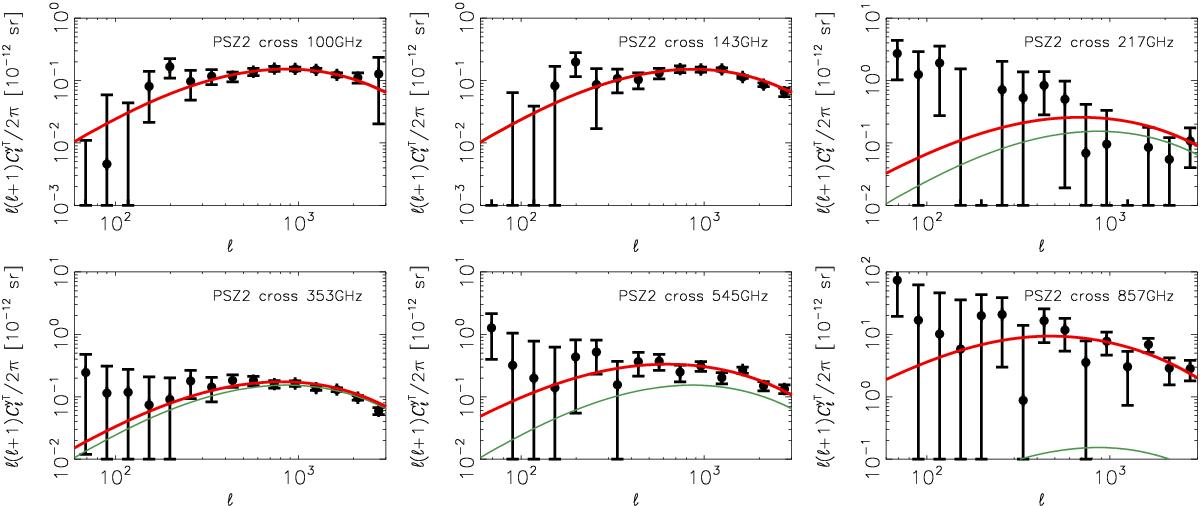
Observed cross-correlation between the tSZ map (yc) of known clusters and the Planck frequency maps (Tν), from 100 to 857 GHz. The data are presented as black circles, the tSZ auto-correlation is in green and the total model yc–Tν accounting for tSZ-CIB correlation is in red for the best-fit of the CIB and tSZ spectra. All power spectra are presented in Compton-parameter units. Uncertainties are dominated by foreground residuals; thus they are highly correlated from one channel to another.
Current usage metrics show cumulative count of Article Views (full-text article views including HTML views, PDF and ePub downloads, according to the available data) and Abstracts Views on Vision4Press platform.
Data correspond to usage on the plateform after 2015. The current usage metrics is available 48-96 hours after online publication and is updated daily on week days.
Initial download of the metrics may take a while.