Fig. 11
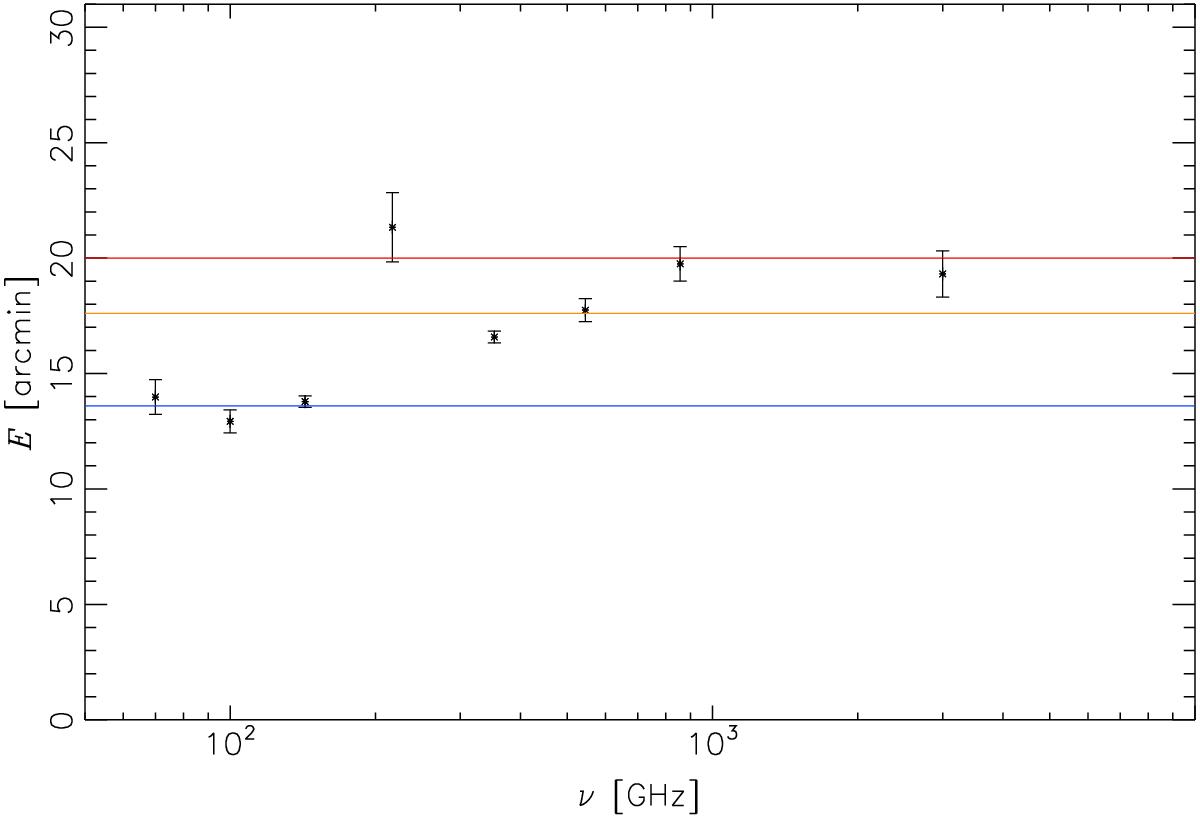
Variation of the spatial extension, ℰ(ν), of the stacked signal from 70 to 3000 GHz (100μm). The blue line shows the expected value for the GNFW profile from Arnaud et al. (2010) and θ500 values from PSZ2, the orange line shows the value we derive with the Xia et al. (2012) profile, and the red line shows the value for an NFW profile with c500 = 1.0.
Current usage metrics show cumulative count of Article Views (full-text article views including HTML views, PDF and ePub downloads, according to the available data) and Abstracts Views on Vision4Press platform.
Data correspond to usage on the plateform after 2015. The current usage metrics is available 48-96 hours after online publication and is updated daily on week days.
Initial download of the metrics may take a while.