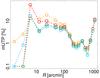
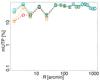
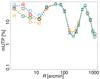
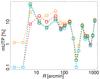
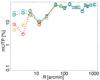
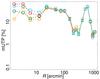
Fig. 6
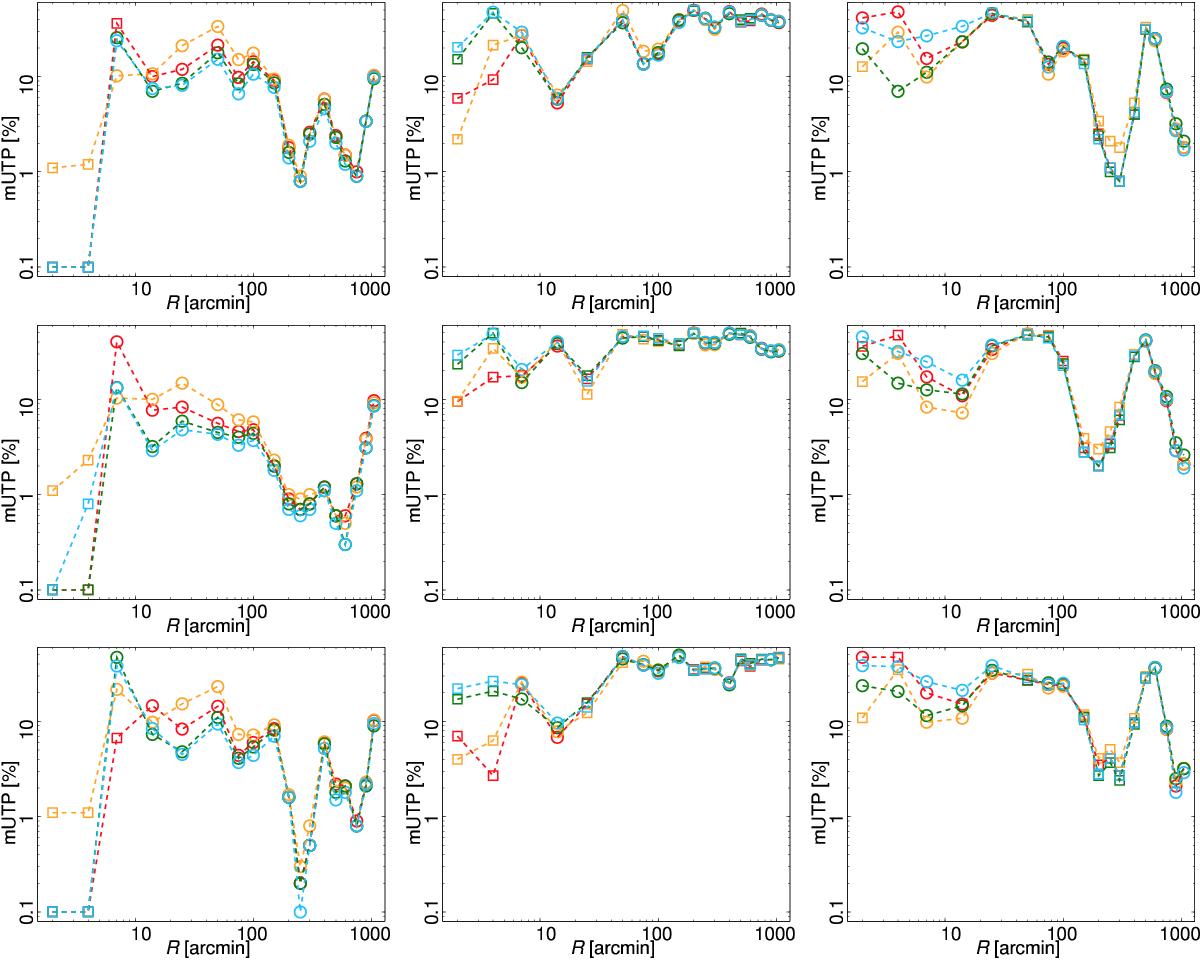
Modified upper tail probabilities (mUTP) obtained from the analyses of the filter coefficients as a function of the filter scale R for the Commander (red), NILC (orange), SEVEM (green), and SMICA (blue) sky maps. From left to right, the panels correspond to standard deviation, skewness, and kurtosis results, when determined using the SMHW (top), GAUSS (middle), and SSG84 (bottom) filters. The squares represent UTP values above 0.5, whereas circles represent UTP values below 0.5.
Current usage metrics show cumulative count of Article Views (full-text article views including HTML views, PDF and ePub downloads, according to the available data) and Abstracts Views on Vision4Press platform.
Data correspond to usage on the plateform after 2015. The current usage metrics is available 48-96 hours after online publication and is updated daily on week days.
Initial download of the metrics may take a while.