Fig. 48
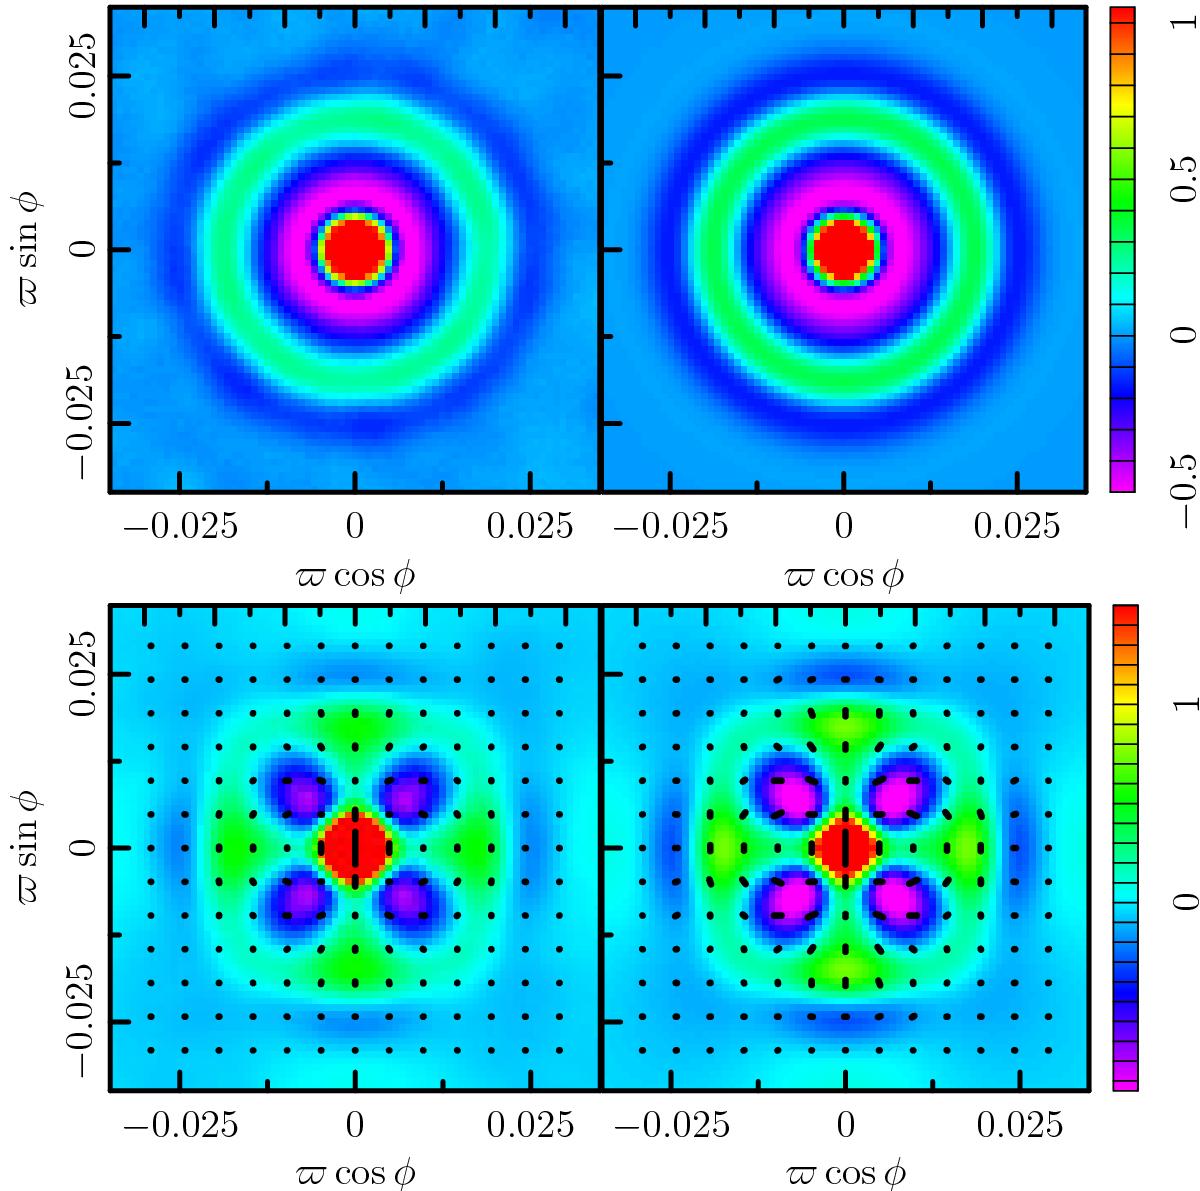
Top: E-mode maps stacked on the unoriented E-mode maxima computed above the null threshold ν = 0. Bottom: Q stacked around oriented polarization amplitude (P) maxima. In this case, no threshold is used and the orientation is chosen such that U = 0 and Q ≥ 0 on the central peak. The left panels are the stacked SMICA maps, and the right panels their corresponding NFEAs. See Fig. 46 for the meaning of the headless vectors (black dashed lines). The image units are μK.
Current usage metrics show cumulative count of Article Views (full-text article views including HTML views, PDF and ePub downloads, according to the available data) and Abstracts Views on Vision4Press platform.
Data correspond to usage on the plateform after 2015. The current usage metrics is available 48-96 hours after online publication and is updated daily on week days.
Initial download of the metrics may take a while.