Fig. 46
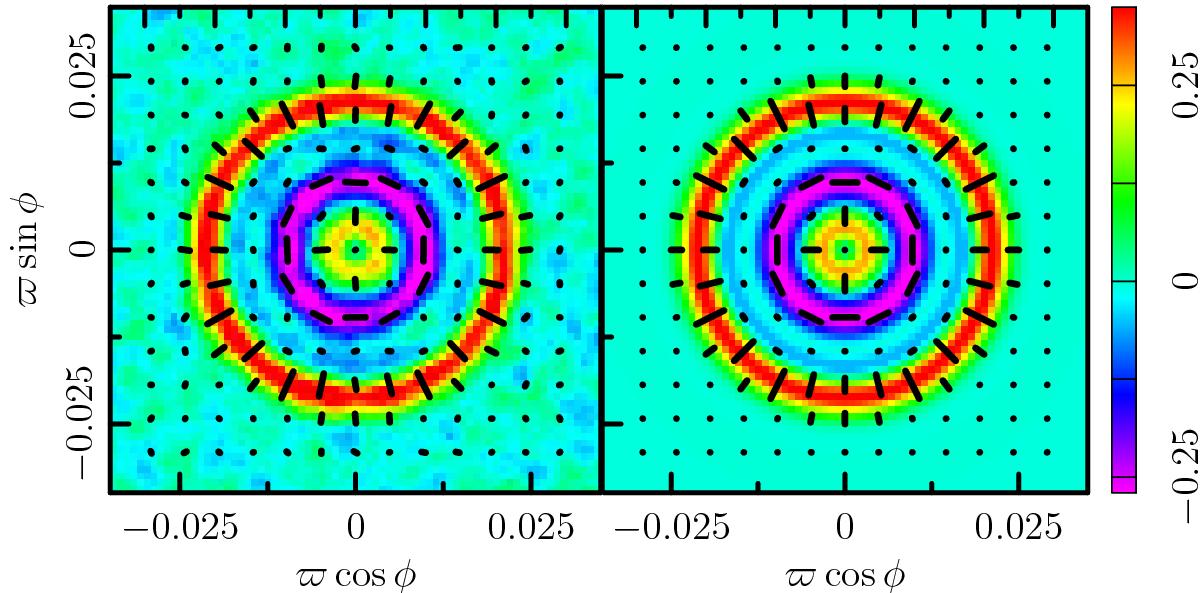
Stacked Qr image around temperature hot spots selected above the null threshold (ν = 0) in the SMICA sky map. The left panel corresponds to the observed data and the right panel shows the NFEA. The image units are μK. The headless vectors (black solid lines) are the polarization directions for stacked Qstack, Ustack. The lengths of the headless vectors are proportional to the polarization amplitude Pstack.
Current usage metrics show cumulative count of Article Views (full-text article views including HTML views, PDF and ePub downloads, according to the available data) and Abstracts Views on Vision4Press platform.
Data correspond to usage on the plateform after 2015. The current usage metrics is available 48-96 hours after online publication and is updated daily on week days.
Initial download of the metrics may take a while.