Free Access
Fig. 45
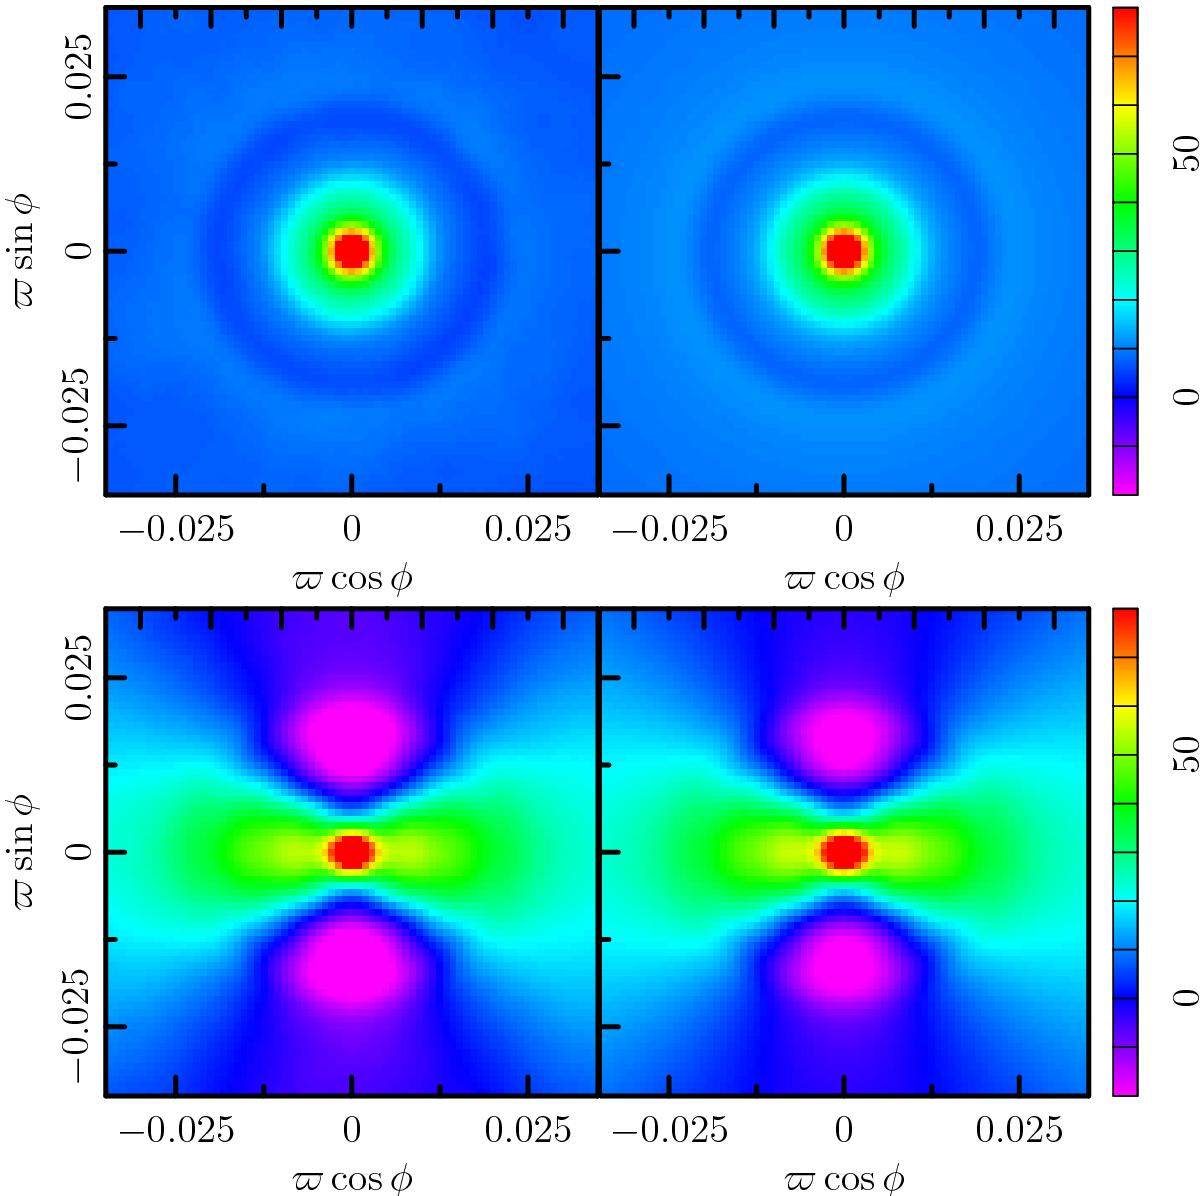
Comparison between unoriented stacking (upper panels) and oriented stacking (lower panels) of temperature patches around temperature hot spots selected above the null threshold (ν = 0). The left panels are the stacked SMICA maps, and the right panels their corresponding NFEAs. The image units are μK.
This figure is made of several images, please see below:
Current usage metrics show cumulative count of Article Views (full-text article views including HTML views, PDF and ePub downloads, according to the available data) and Abstracts Views on Vision4Press platform.
Data correspond to usage on the plateform after 2015. The current usage metrics is available 48-96 hours after online publication and is updated daily on week days.
Initial download of the metrics may take a while.