Fig. 44
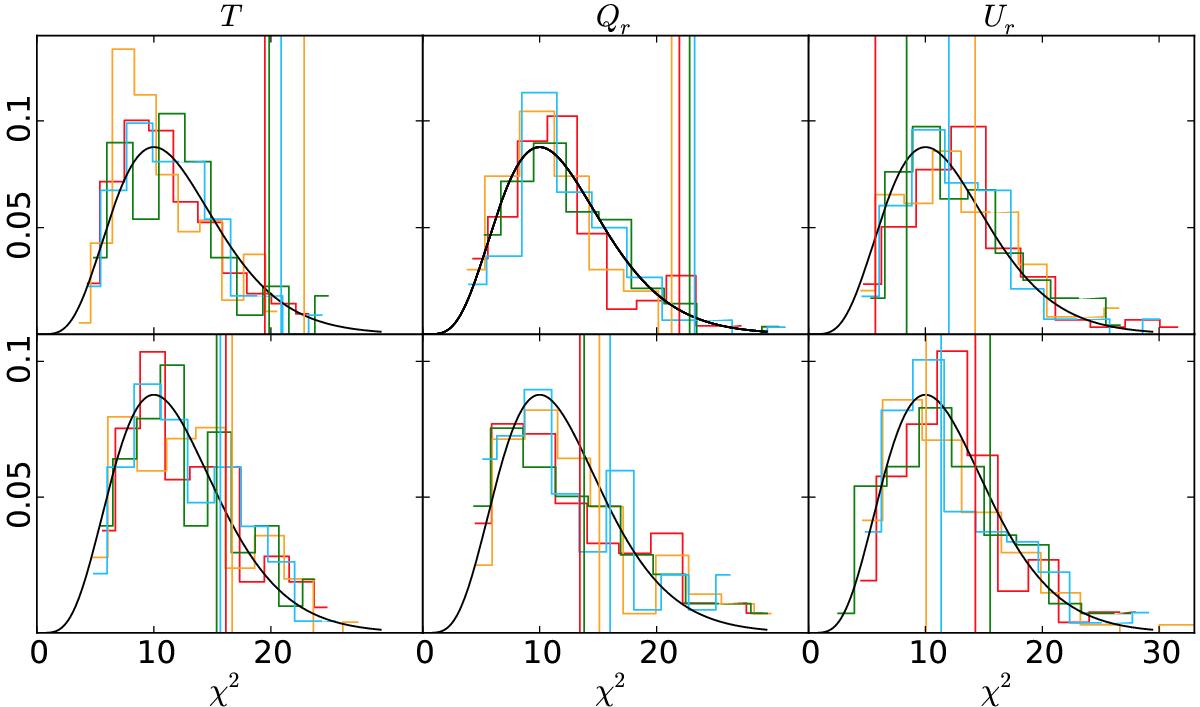
χ2 distributions obtained from the T (left column), Qr (middle column), and Ur (right column) mean radial profiles centred on temperature hot spots selected above the null threshold (upper row) and three times the dispersion of the map (bottom row). The black lines correspond to the theoretical χ2 distribution with 12 degrees of freedom, whilst the histograms show the distributions determined from 100 simulations computed through the Commander (red), NILC (orange), SEVEM (green), and SMICA (blue) pipelines. The vertical lines represent the χ2 values obtained from the data.
Current usage metrics show cumulative count of Article Views (full-text article views including HTML views, PDF and ePub downloads, according to the available data) and Abstracts Views on Vision4Press platform.
Data correspond to usage on the plateform after 2015. The current usage metrics is available 48-96 hours after online publication and is updated daily on week days.
Initial download of the metrics may take a while.