Fig. 43
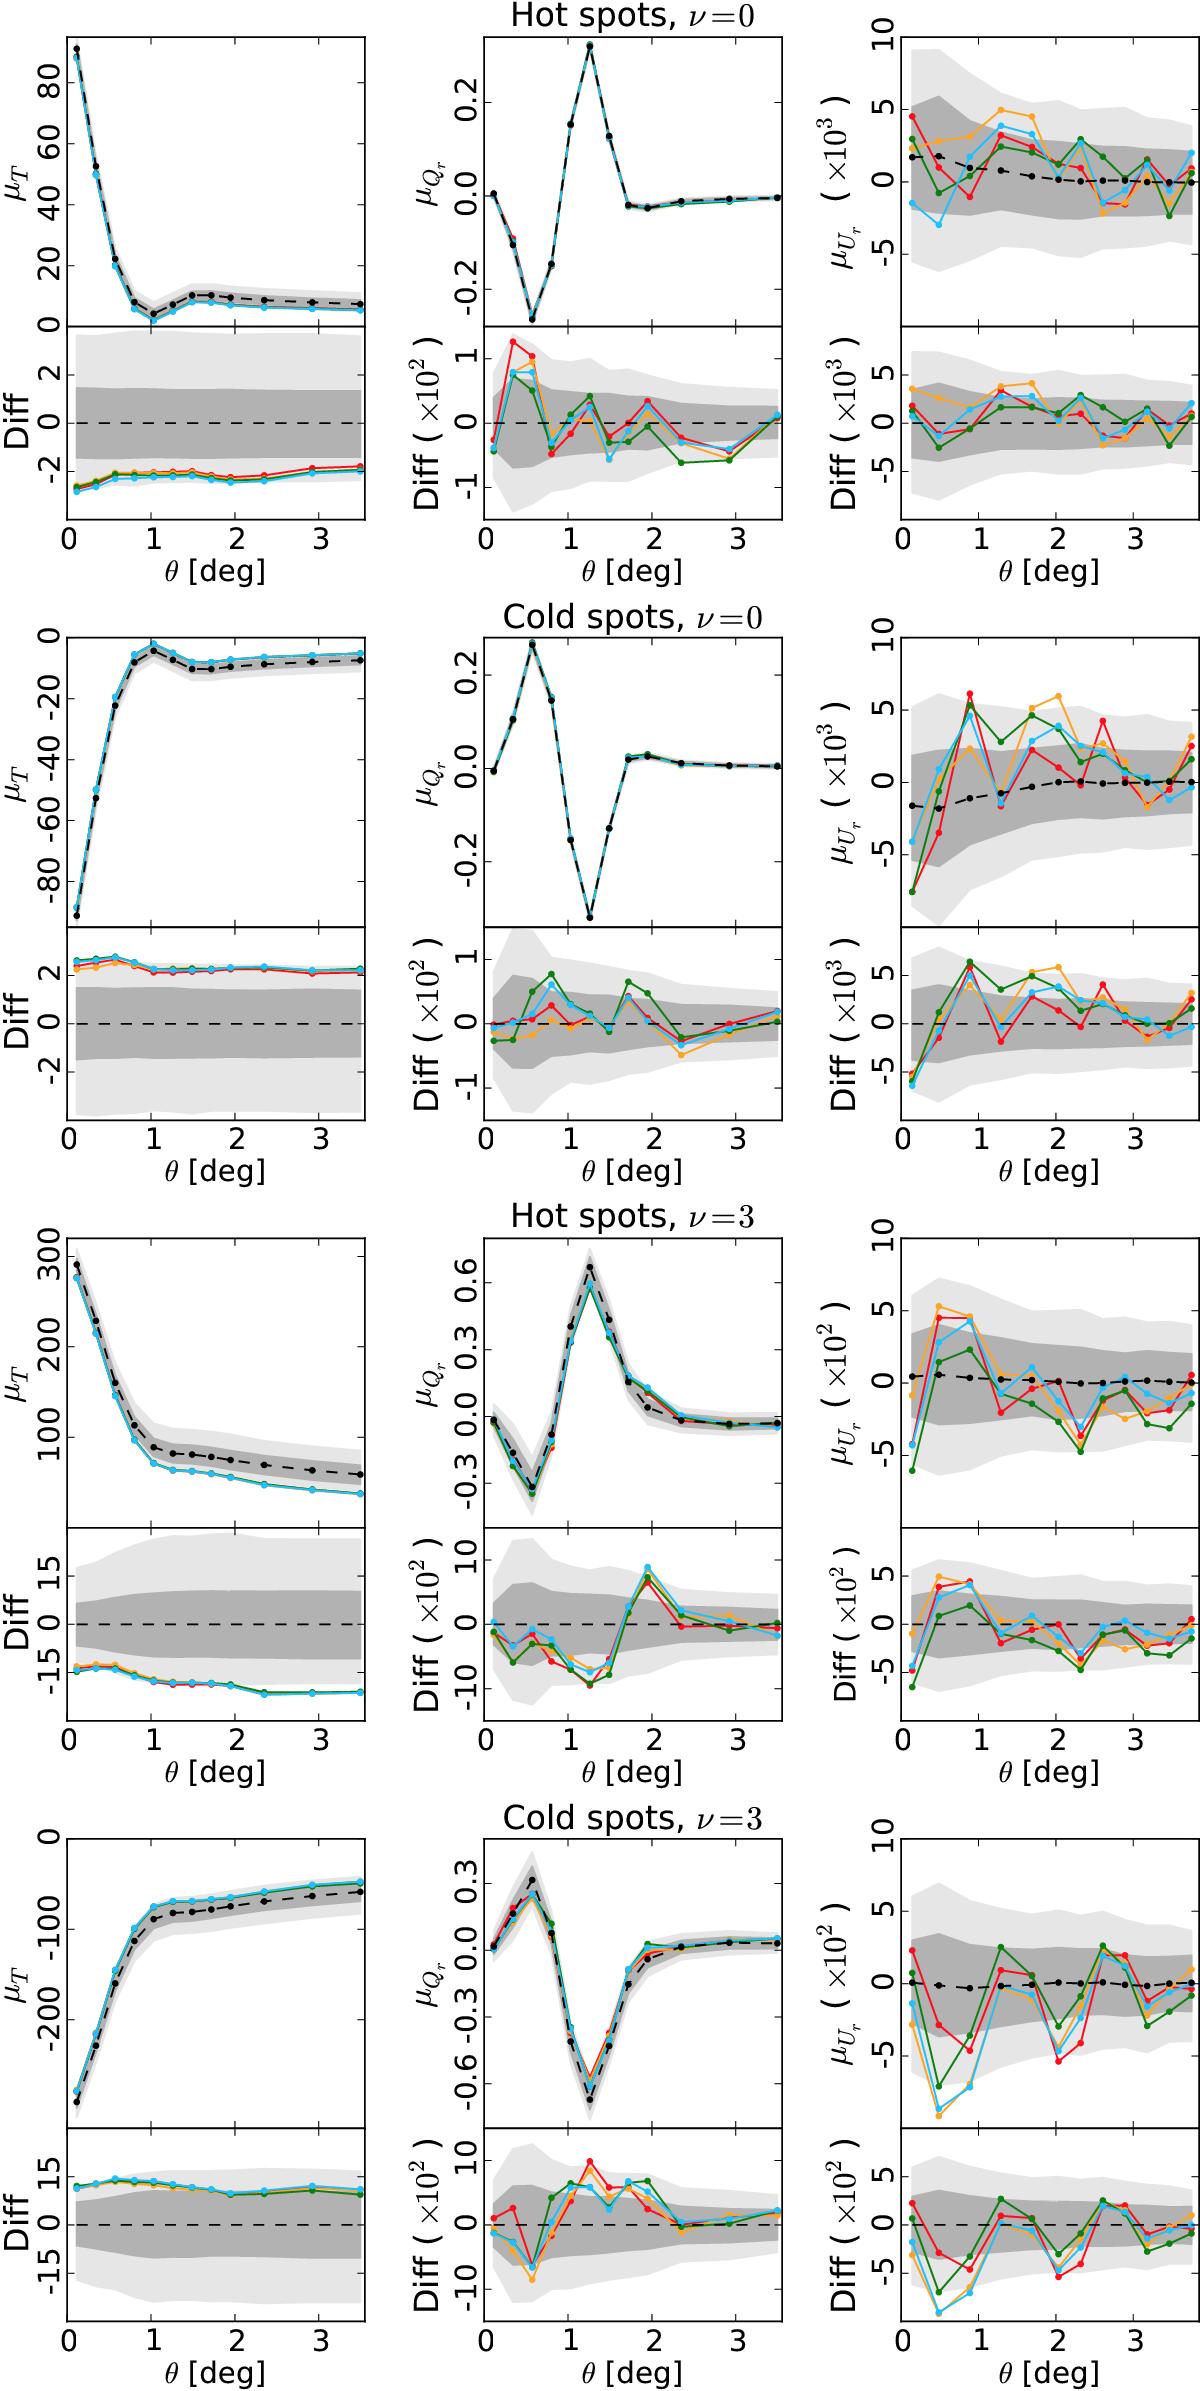
Mean radial profiles of T, Qr, and Ur in μK obtained for Commander (red), NILC (orange), SEVEM (green), and SMICA (blue). Each individual panel contains (top) the mean radial profiles and (bottom) the differences (denoted “Diff”) between the mean profiles of the data and those computed from the ensemble mean of the simulations. Results based on stacks around temperature hot and cold spots are shown in the left and right columns, respectively. Upper plots present results for peaks selected above the null threshold, while lower plots show the equivalent results for peak amplitudes above (hot spots) or below (cold spots) 3 times the dispersion of the temperature map. The black dots (connected by dashed lines) depict the mean profiles and the shaded regions correspond to the 1σ (68%) and 2σ (95%) error bars. The mean profiles and error bars are determined from SEVEM simulations. Note that the Diff curves for each component-separation method are computed using the corresponding ensemble average, although only the ensemble average from SEVEM is shown here.
Current usage metrics show cumulative count of Article Views (full-text article views including HTML views, PDF and ePub downloads, according to the available data) and Abstracts Views on Vision4Press platform.
Data correspond to usage on the plateform after 2015. The current usage metrics is available 48-96 hours after online publication and is updated daily on week days.
Initial download of the metrics may take a while.