Fig. 42
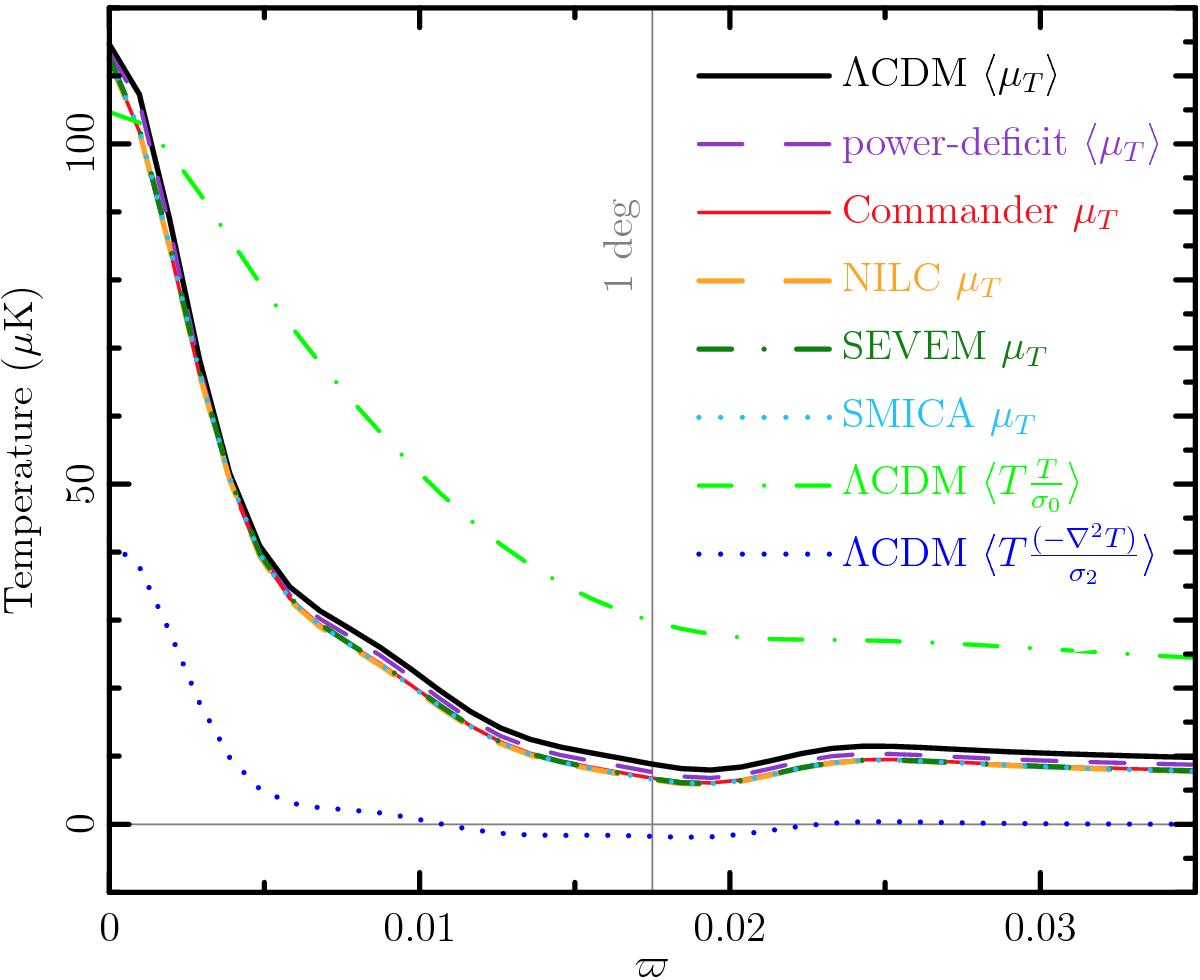
Radial profile μT(ϖ) derived from the stacked temperature image (see Fig. 41 or 45). The denominators σ0 and σ2 are the theoretical rms values of CMB T and ∇2T, respectively. The theoretical ⟨ μT(ϖ) ⟩ is a linear combination of ⟨ T(ϖ)(T(0) /σ0) ⟩ (green dash-dotted line) and ⟨ T(ϖ)(−∇2T(0)) /σ2) ⟩ (blue dotted line). For all four component-separated maps, the deviation of μT from the ensemble mean ⟨ μT ⟩ of the fiducial model (here the Planck 2015 ΛCDM best fit) is consistent with cosmic variance, and can be related to the low-ℓ power deficit. The example power-deficit ⟨ μT ⟩ (purple dashed line) is the theoretical prediction of ⟨ μT ⟩ if the fiducial model Cℓs are reduced by 10% in the range 2 ≤ ℓ ≤ 50.
Current usage metrics show cumulative count of Article Views (full-text article views including HTML views, PDF and ePub downloads, according to the available data) and Abstracts Views on Vision4Press platform.
Data correspond to usage on the plateform after 2015. The current usage metrics is available 48-96 hours after online publication and is updated daily on week days.
Initial download of the metrics may take a while.