Fig. 41
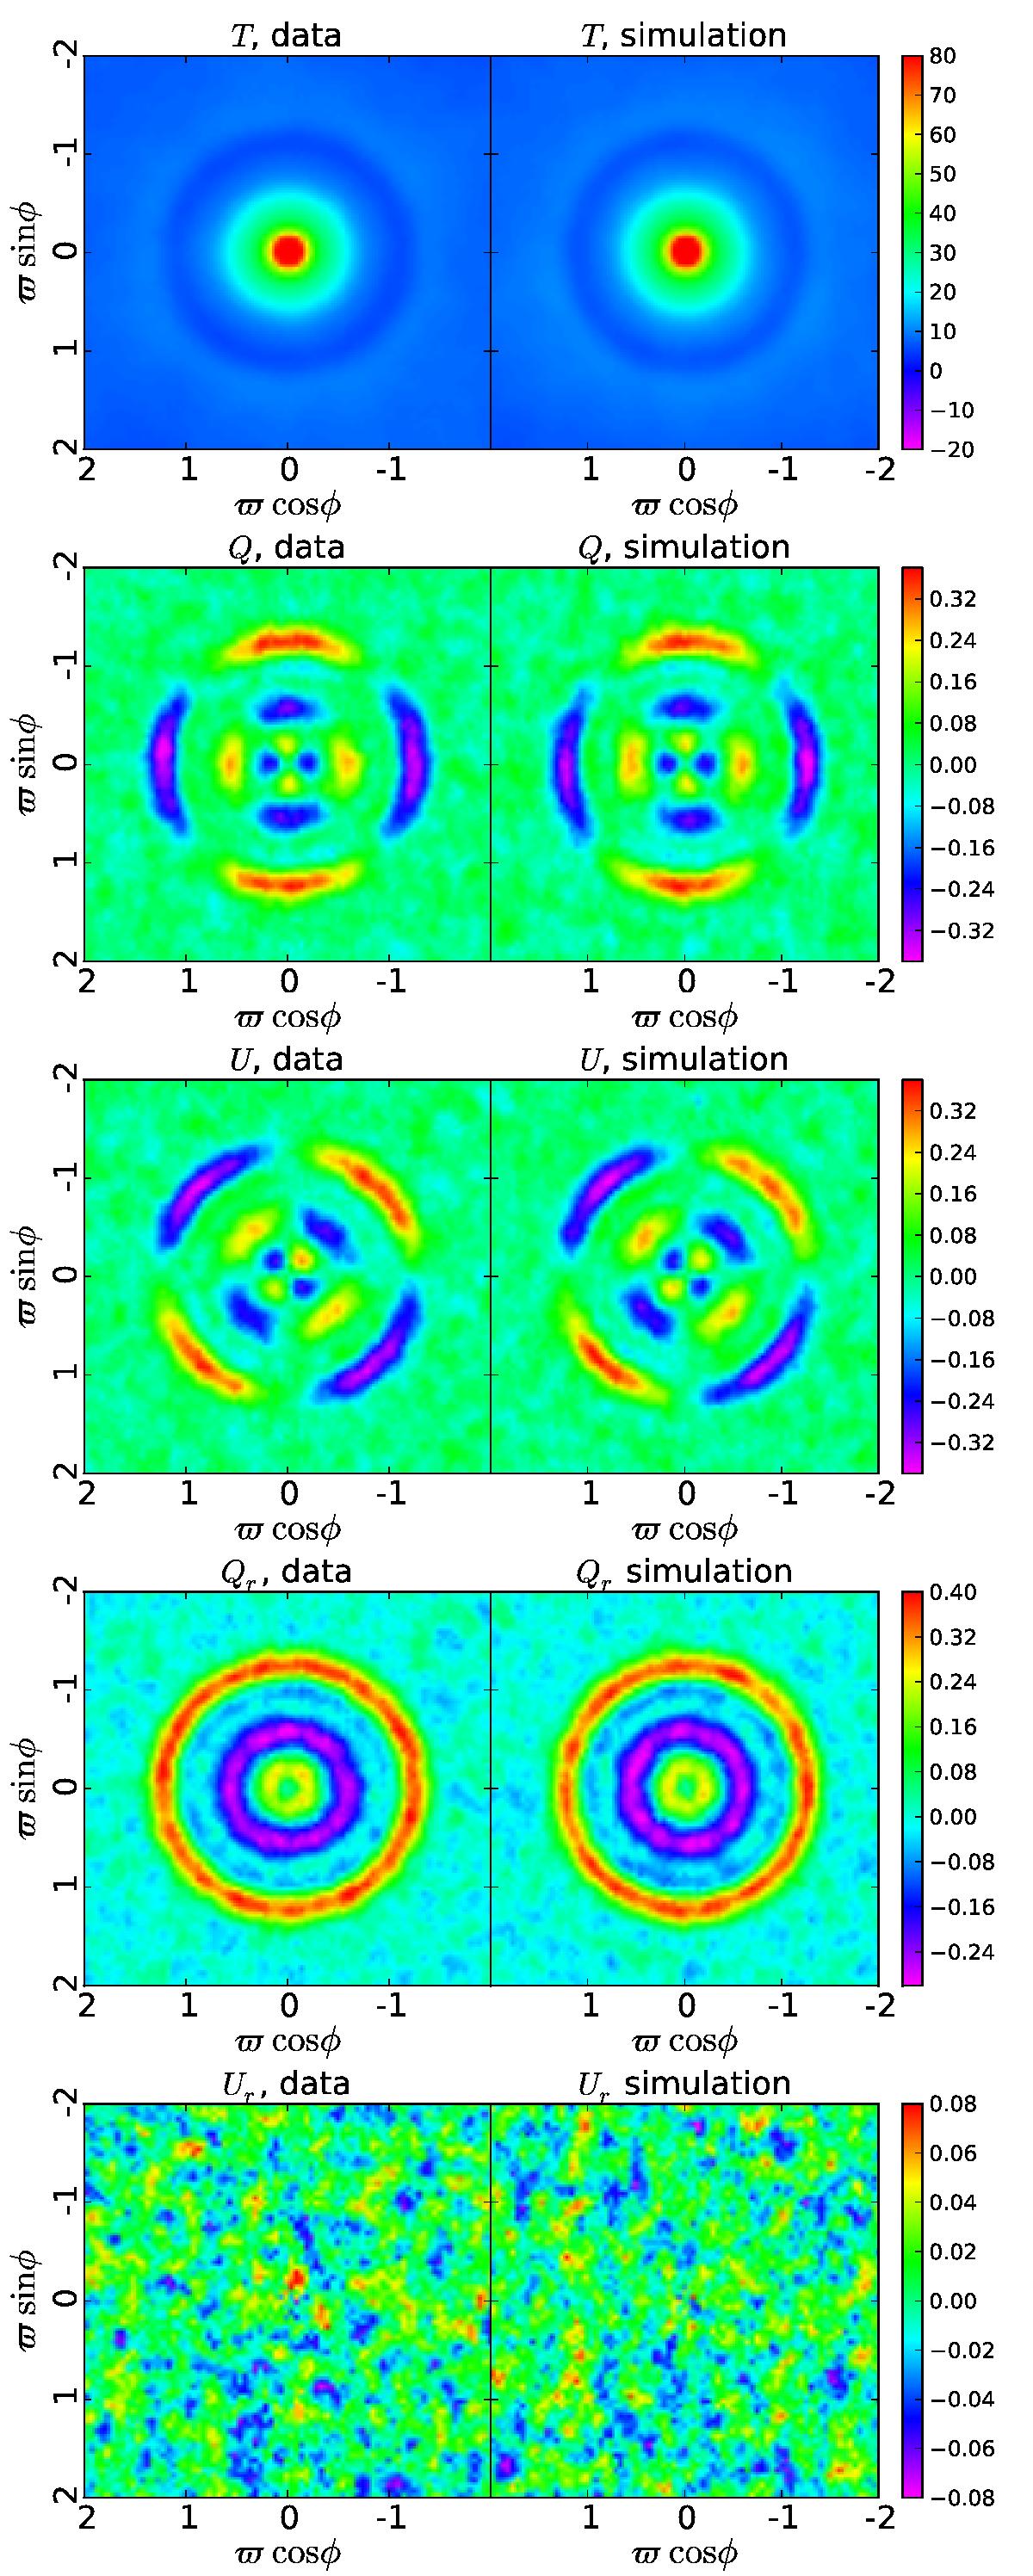
From top to bottom, T, Q, U, Qr, and Ur stacked images (in μK units) extracted around temperature hot spots selected above the null threshold (ν = 0) in the Commander sky map for data (left column) and an equivalent simulation (right column). The horizontal and vertical axes of the flat-sky projection are labelled in degrees.
Current usage metrics show cumulative count of Article Views (full-text article views including HTML views, PDF and ePub downloads, according to the available data) and Abstracts Views on Vision4Press platform.
Data correspond to usage on the plateform after 2015. The current usage metrics is available 48-96 hours after online publication and is updated daily on week days.
Initial download of the metrics may take a while.