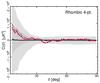
Fig. 40
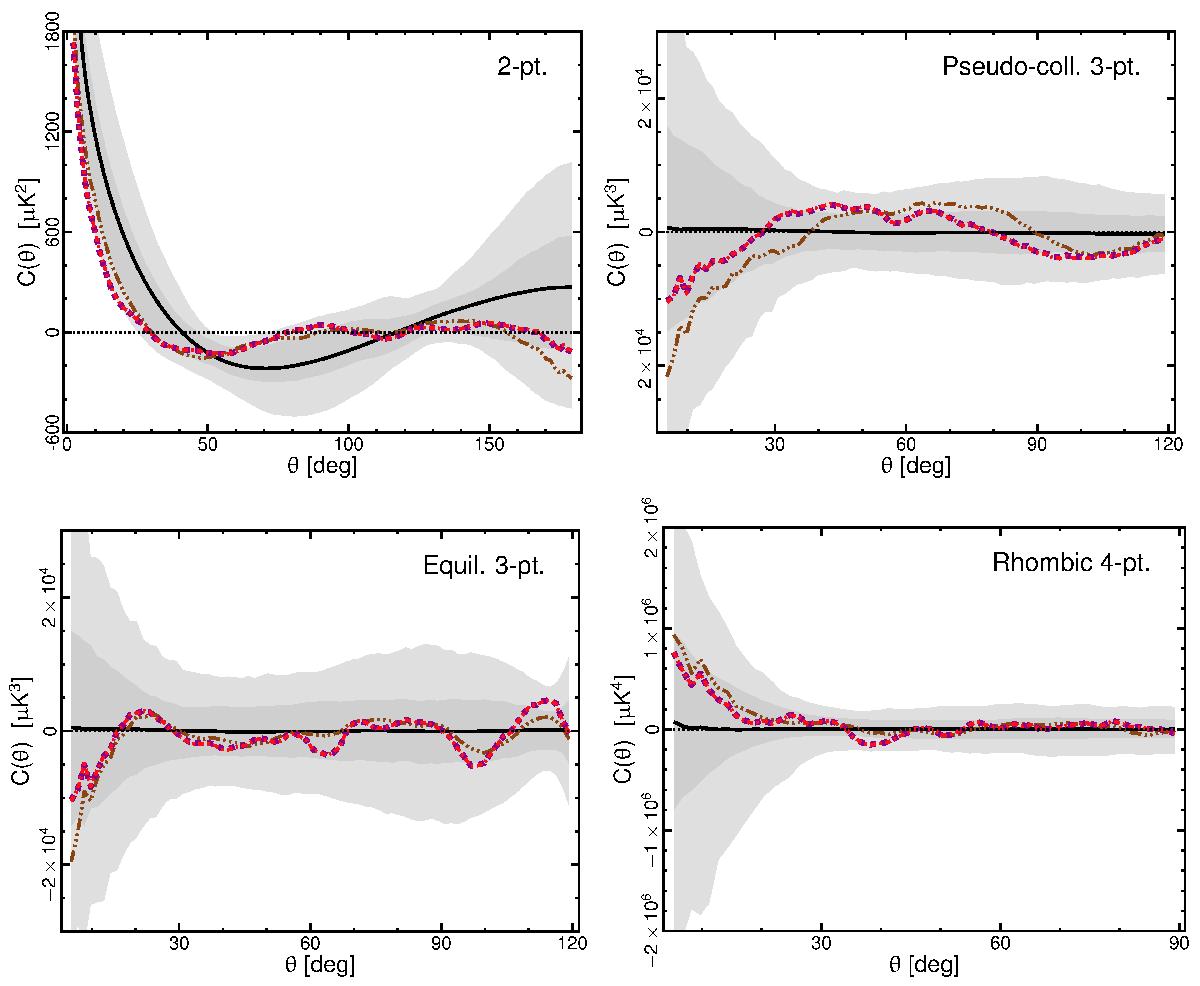
N-point correlation functions determined from the Nside = 64Planck CMB 2015 temperature estimates. Results are shown for the 2-point, pseudo-collapsed 3-point (upper left and right panels, respectively), equilateral 3-point, and connected rhombic 4-point functions (lower left and right panels, respectively). The brown three dot-dashed, purple dashed, and red dot-dashed lines correspond to the Lkl-Commander map analysed using the low-ℓ and common masks and the Commander map analysed using the common mask, respectively. Note that the dashed and dot-dashed lines lie on top of each other. The black solid line indicates the mean for 1000 MC simulations. The shaded dark and light grey regions indicate the 68% and 95% confidence regions, respectively, estimated using 1000 Commander simulations. See Sect. 4.3 for the definition of the separation angle θ.
Current usage metrics show cumulative count of Article Views (full-text article views including HTML views, PDF and ePub downloads, according to the available data) and Abstracts Views on Vision4Press platform.
Data correspond to usage on the plateform after 2015. The current usage metrics is available 48-96 hours after online publication and is updated daily on week days.
Initial download of the metrics may take a while.