Fig. 4
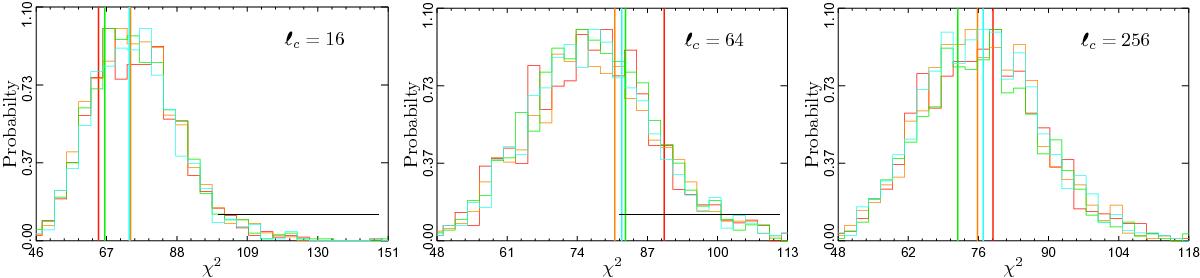
Histograms of χ2 for the Planck 2015 Commander (red), NILC (orange), SEVEM (green), and SMICA (blue) foreground-cleaned maps analysed with the common mask. The χ2 is obtained by combining the three MFs in needlet space with an appropiate covariance matrix. The histograms are for the FFP8 simulations, while the vertical lines are for the data. The figures from left to right are for the needlet scales j = 4,6, and 8, with the central multipoles ℓc = 2j shown in each panel.
Current usage metrics show cumulative count of Article Views (full-text article views including HTML views, PDF and ePub downloads, according to the available data) and Abstracts Views on Vision4Press platform.
Data correspond to usage on the plateform after 2015. The current usage metrics is available 48-96 hours after online publication and is updated daily on week days.
Initial download of the metrics may take a while.