Fig. 39
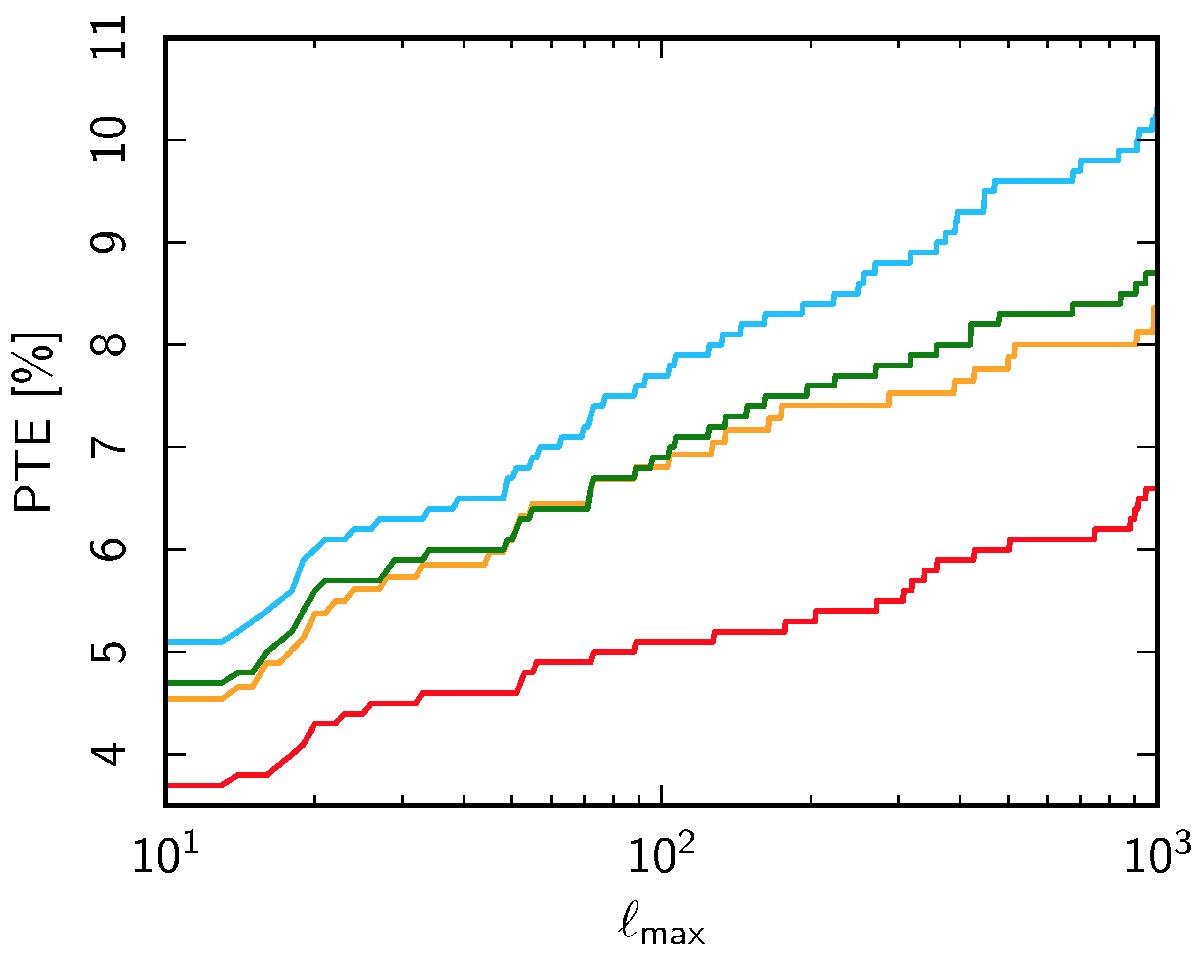
Probability to exceed (PTE) the p-value of the signal from the Commander (red), NILC (orange), SEVEM (green), and SMICA (blue) data at ℓ = 230–240 (which is the multipole range with the most significant deviation) when searching over a range of multipoles up to ℓmax, for the RS determined from the QML analysis. Much like the equivalent curve for dipole modulation, the PTE appears to grow approximately logarithmically with ℓmax.
Current usage metrics show cumulative count of Article Views (full-text article views including HTML views, PDF and ePub downloads, according to the available data) and Abstracts Views on Vision4Press platform.
Data correspond to usage on the plateform after 2015. The current usage metrics is available 48-96 hours after online publication and is updated daily on week days.
Initial download of the metrics may take a while.