Fig. 38
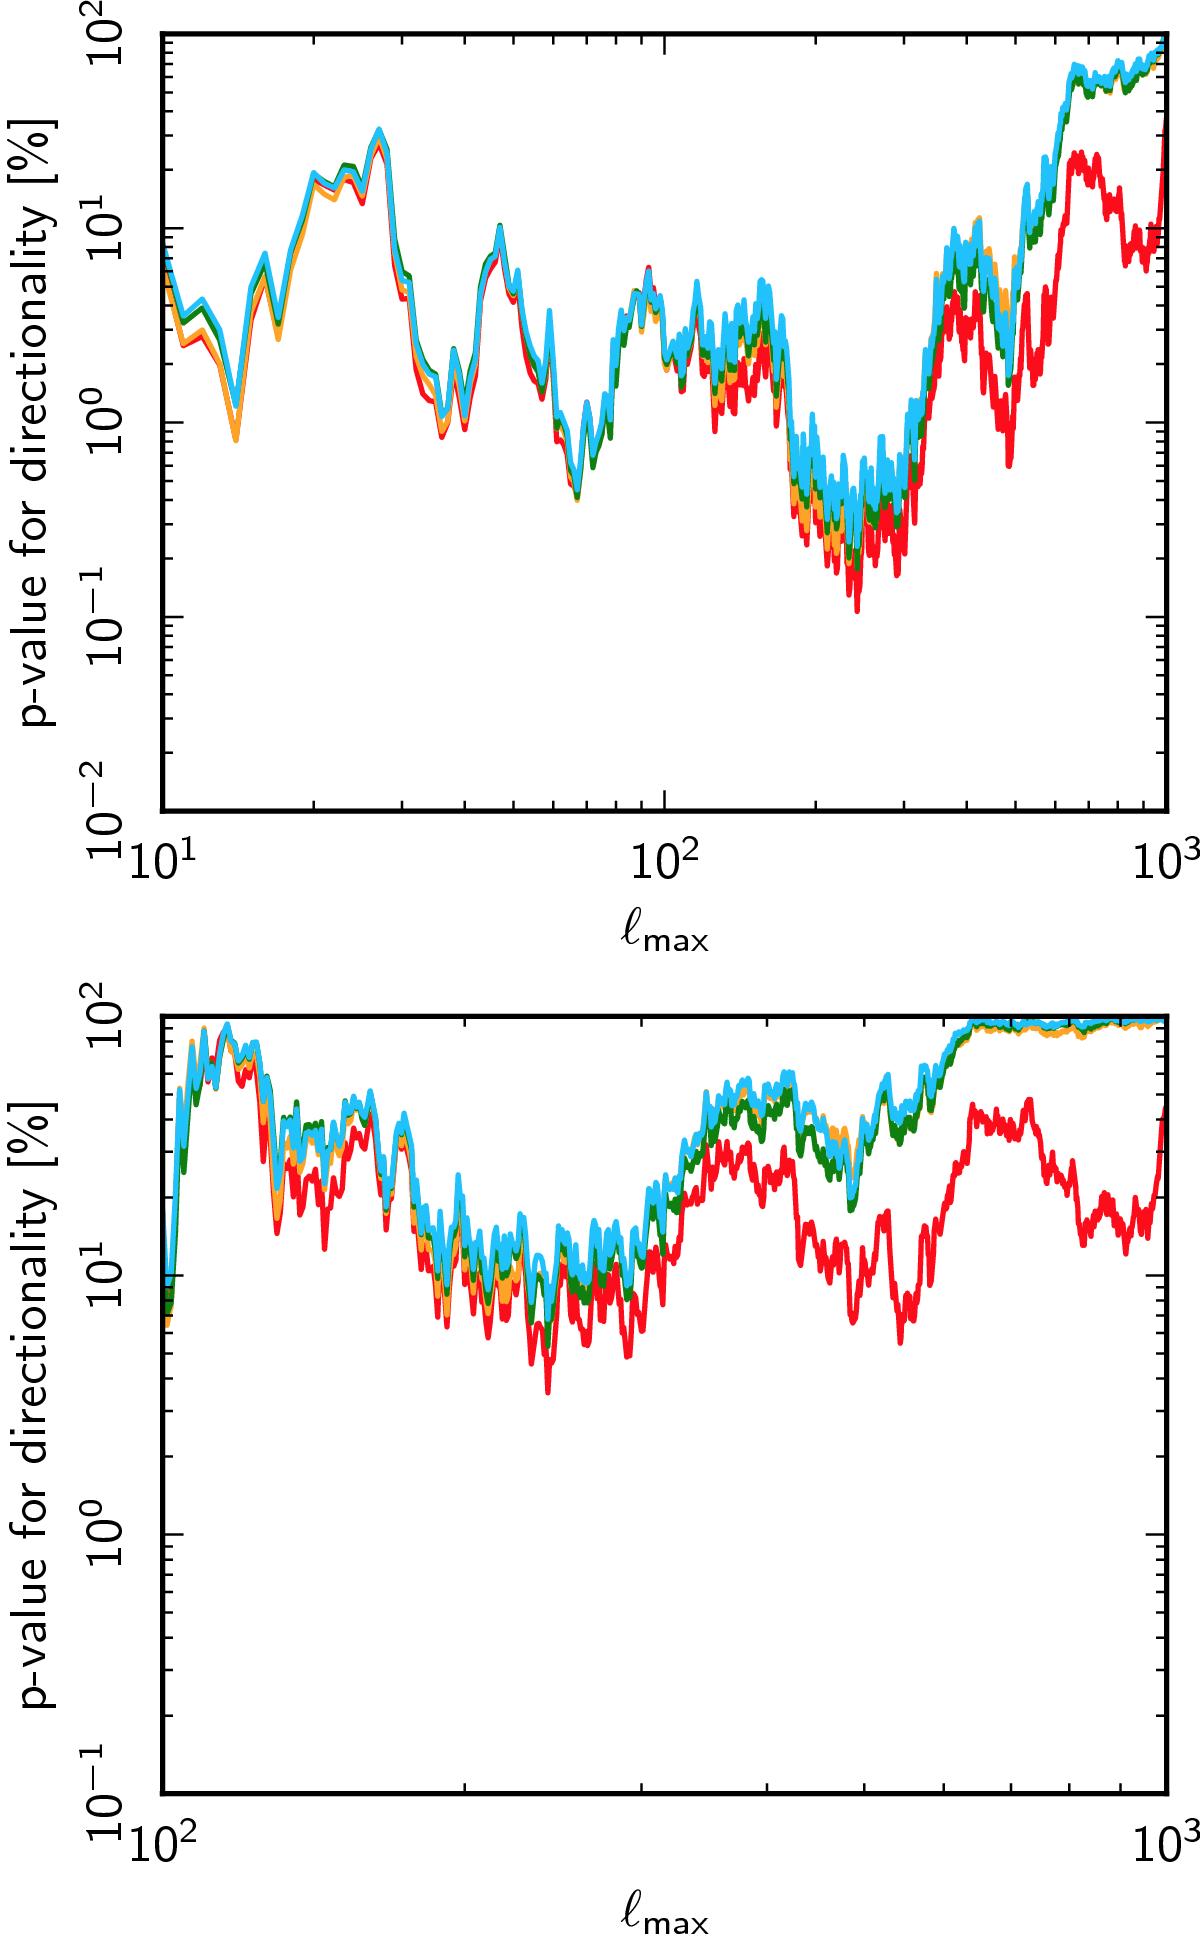
Rayleigh statistic p-values determined from the QML analysis as a function of ℓmax for the Commander (red), NILC (orange), SEVEM (green), and SMICA (blue) data sets, with (top panel) ℓmin = 2 and (bottom panel) ℓmin = 100. The general pattern of peaks is very similar to that in Fig. 30. We emphasize that the statistic here is cumulative and as such trends in the curves can be misleading.
Current usage metrics show cumulative count of Article Views (full-text article views including HTML views, PDF and ePub downloads, according to the available data) and Abstracts Views on Vision4Press platform.
Data correspond to usage on the plateform after 2015. The current usage metrics is available 48-96 hours after online publication and is updated daily on week days.
Initial download of the metrics may take a while.