Fig. 37
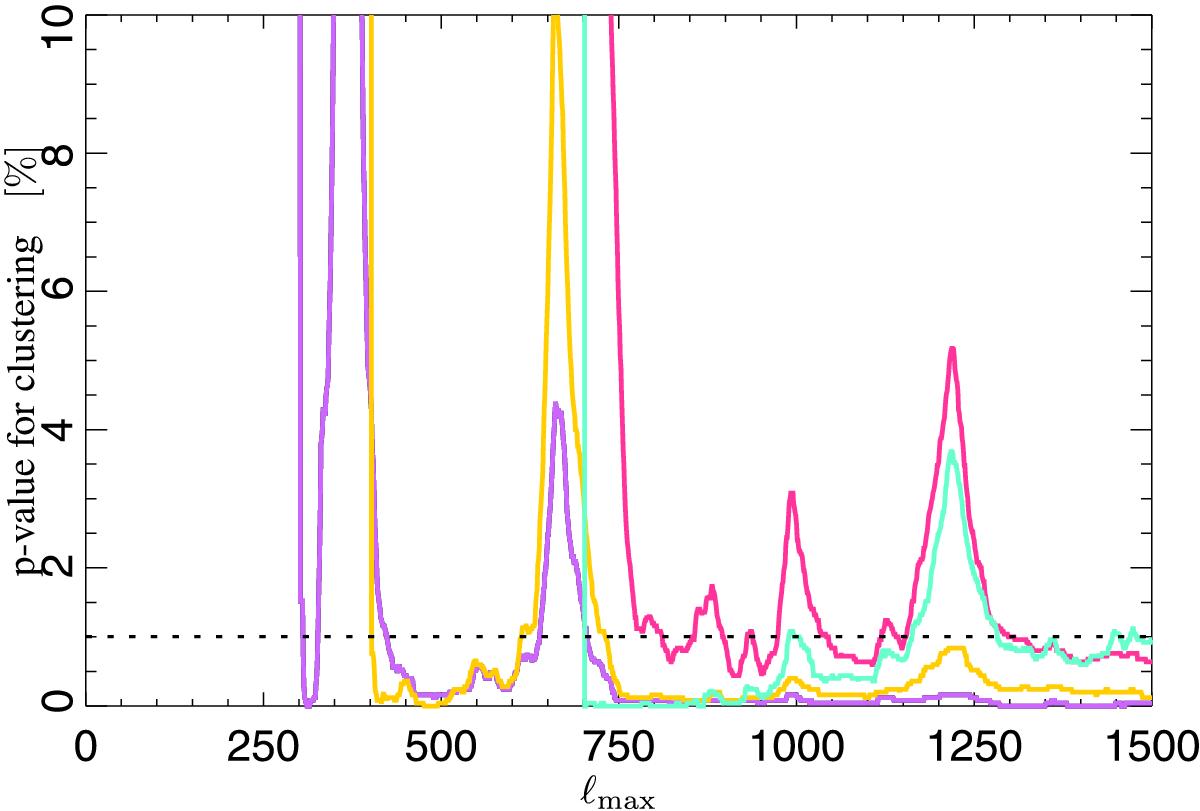
Derived p-values for the angular clustering analysis as a function of ℓmax, determined from SMICA based on 2500 simulations. The p-values are based on the fraction of simulations with a higher Rayleigh statistic up to the given ℓmax than in the data. The RS here is calculated over all pairs of dipole directions where one dipole in each pair is computed in the range [ℓlim,ℓmax], and the other is determined in the range [2,ℓlim]. The plot shows p-values for ℓlim = 300 (purple), ℓlim = 400 (yellow), ℓlim = 500 (pink), and ℓlim = 700 (cyan). The results have been marginalized over bin sizes in the range Δℓ = 8 to Δℓ = 32.
Current usage metrics show cumulative count of Article Views (full-text article views including HTML views, PDF and ePub downloads, according to the available data) and Abstracts Views on Vision4Press platform.
Data correspond to usage on the plateform after 2015. The current usage metrics is available 48-96 hours after online publication and is updated daily on week days.
Initial download of the metrics may take a while.