Fig. 35
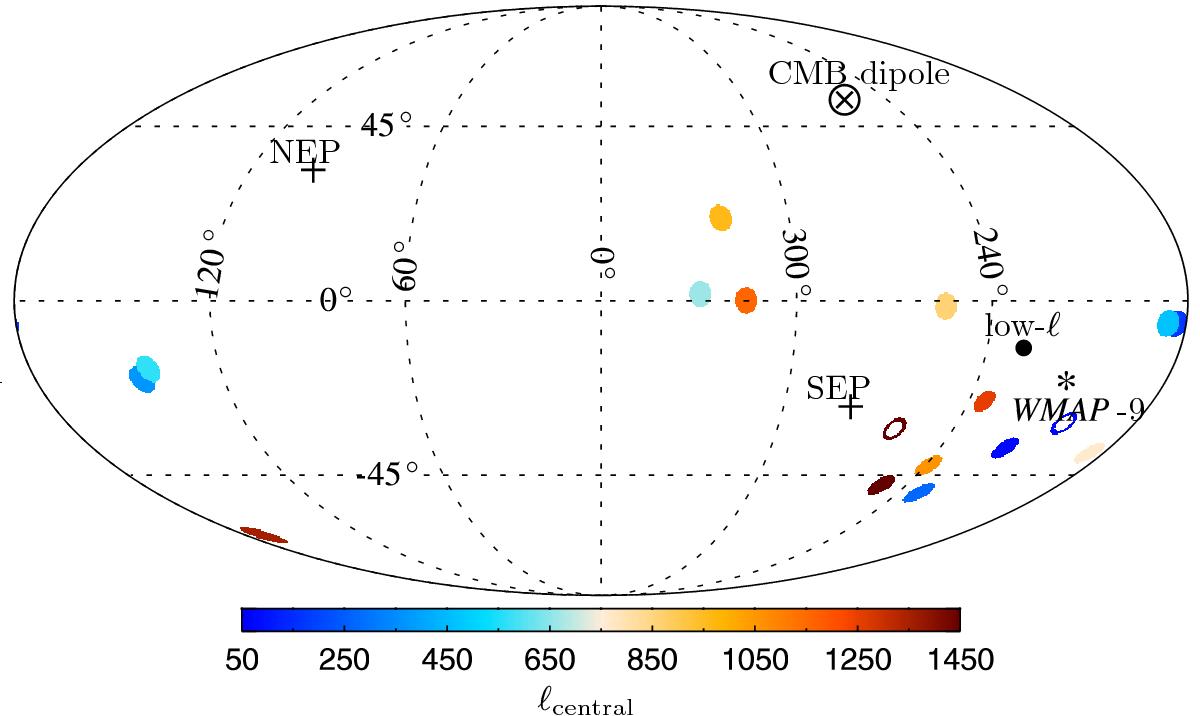
Dipole directions for independent 100-multipole bins of the local power spectrum distribution from ℓ = 2 to 1500 in the SMICA map with the common mask applied. We also show the preferred dipolar modulation axis (labelled as “low-ℓ”) derived in Sect. 6.2, as well as the total direction for ℓmax = 600 determined from WMAP-9 (Axelsson et al. 2013). The average directions determined from the two multipole ranges ℓ ∈ [2,300] and ℓ ∈ [750,1500] are shown as blue and red rings, respectively. The error on the derived direction that results from masking the data is about 60°, with only small variations related to bin size.
Current usage metrics show cumulative count of Article Views (full-text article views including HTML views, PDF and ePub downloads, according to the available data) and Abstracts Views on Vision4Press platform.
Data correspond to usage on the plateform after 2015. The current usage metrics is available 48-96 hours after online publication and is updated daily on week days.
Initial download of the metrics may take a while.