Fig. 33
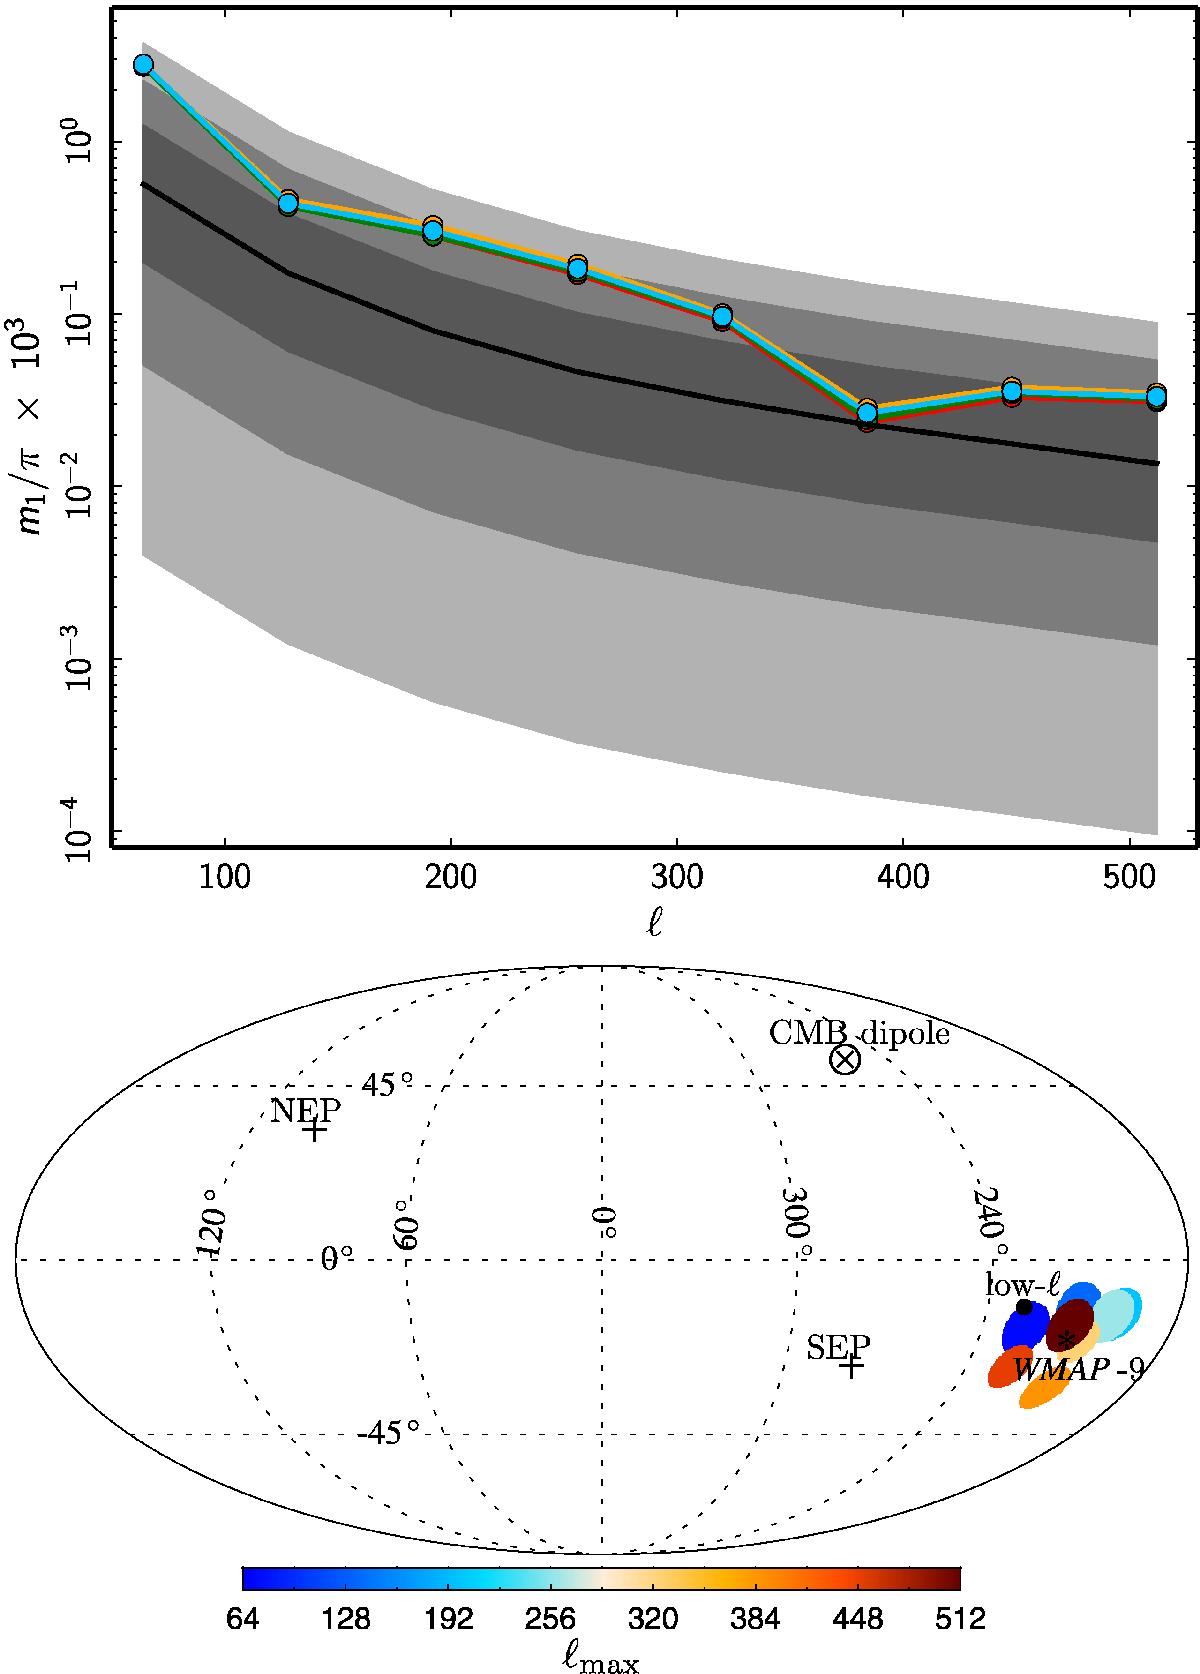
Top: measured dipole modulation power in cumulative CMB multipole bins for Commander (red), NILC (orange), SEVEM (green), and SMICA (blue) as determined from a BipoSH analysis of the data.. Colour coding as in Fig. 32. Note that the measurements in cumulative bins indicate a power in excess of 2σ up to multipole ℓmax ~ 320. The value on the horizontal axis denotes the maximum multipole used in the analysis, with ℓmin = 2. Bottom: modulation dipole direction as recovered from the SMICA map. The directions found from the other component-separation maps are consistent with these directions. The colour-coded points represent the directions recovered for the specific ℓmax used in the analysis, with ℓmin = 2. The low-ℓ and WMAP-9 directions are identical to those in Fig. 35.
Current usage metrics show cumulative count of Article Views (full-text article views including HTML views, PDF and ePub downloads, according to the available data) and Abstracts Views on Vision4Press platform.
Data correspond to usage on the plateform after 2015. The current usage metrics is available 48-96 hours after online publication and is updated daily on week days.
Initial download of the metrics may take a while.