Fig. 32
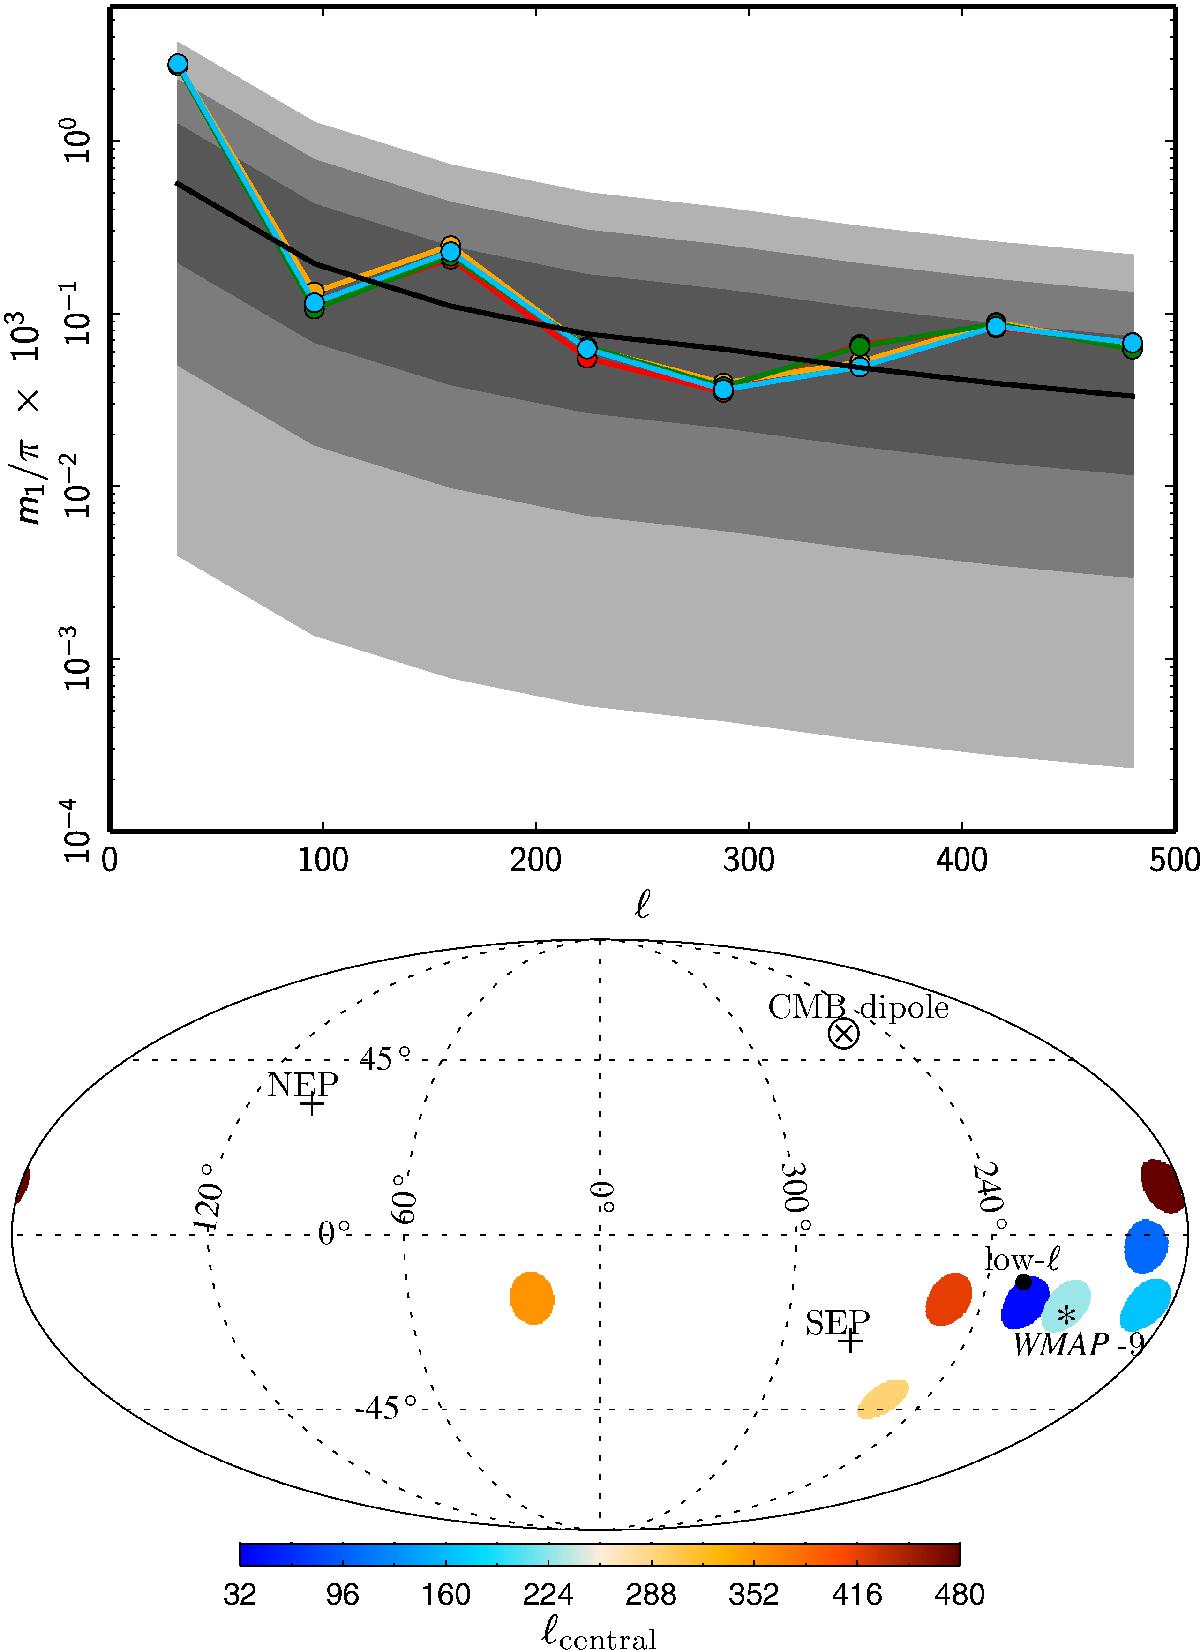
Top: measured dipole modulation (L = 1) power in non-overlapping CMB multipole bins for Commander (red), NILC (orange), SEVEM (green), and SMICA (blue) as determined from a BipoSH analysis of the data. The power in the dipole of the modulation field is a χ2-distributed variable with 3 degrees of freedom. The shaded regions in the plot depict, in dark-grey, grey, and light-grey respectively, the 1, 2, and 3σ equivalent intervals of the distribution function derived from simulations, while the solid black line denotes its median. Significant power in the dipole modulation is seen to be limited to ℓ = 2–64 and does not extend to higher multipoles. Bottom: dipole modulation direction as determined from the SMICA map. The directions found from the other component separation maps are consistent with this analysis. The coloured circles denote the central value of the multipole bin used in the analysis, as specified in the colour bar. The low-ℓ and WMAP-9 directions are identical to those in Fig. 35.
Current usage metrics show cumulative count of Article Views (full-text article views including HTML views, PDF and ePub downloads, according to the available data) and Abstracts Views on Vision4Press platform.
Data correspond to usage on the plateform after 2015. The current usage metrics is available 48-96 hours after online publication and is updated daily on week days.
Initial download of the metrics may take a while.