Fig. 3
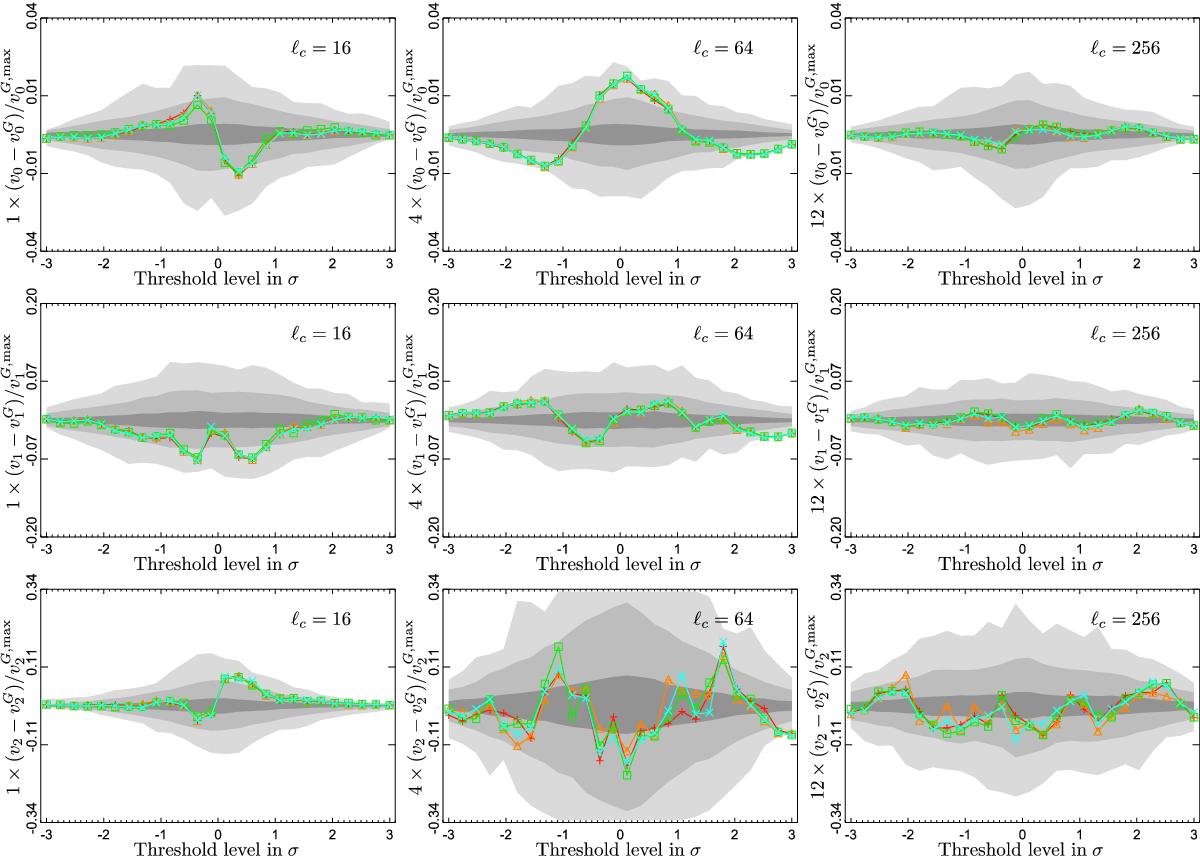
Needlet space MFs for Planck 2015 data using the four component-separated maps, Commander (red), NILC (orange), SEVEM (green), and SMICA (blue); the grey regions, from dark to light, correspond, respectively, to 1, 2, and 3σ confidence regions estimated from the 1000 FFP8 simulations processed by the Commander method. The columns from left to right correspond to the needlet parameters j = 4,6, and 8, respectively; the jth needlet parameter has compact support over multipole ranges [2j−1,2j + 1]. The ℓc = 2j value indicates the central multipole of the corresponding needlet map. Note that to have the same range at all the needlet scales, the vertical axis has been multiplied by a factor that takes into account the steady decrease of the variance of the MFs as a function of scale.
Current usage metrics show cumulative count of Article Views (full-text article views including HTML views, PDF and ePub downloads, according to the available data) and Abstracts Views on Vision4Press platform.
Data correspond to usage on the plateform after 2015. The current usage metrics is available 48-96 hours after online publication and is updated daily on week days.
Initial download of the metrics may take a while.