Fig. 28
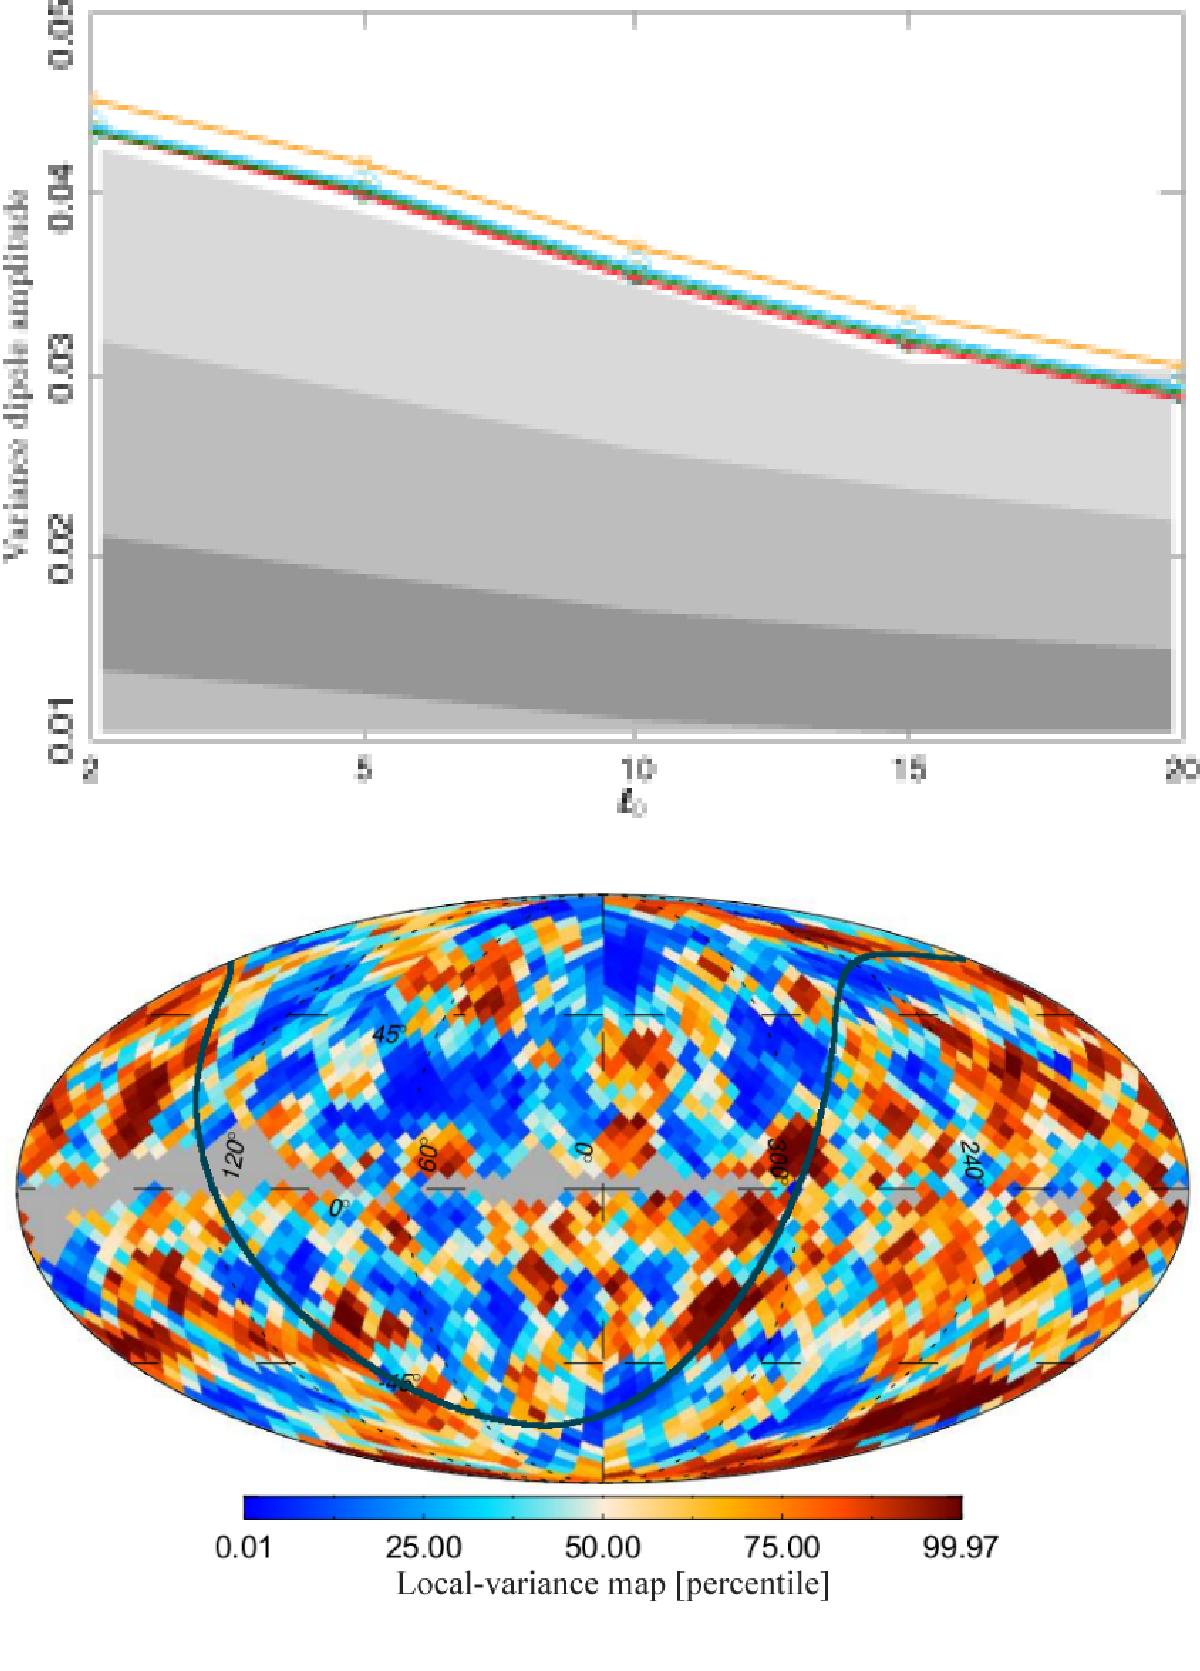
Upper panel: local-variance dipole amplitude for 8° discs as a function of the central multipole of the high-pass filter, ℓ0, for the four component-separation methods, Commander (red), NILC (orange), SEVEM (green), and SMICA (blue). The grey regions, from dark to light, correspond, respectively, to 1σ, 2σ, and 3σ percentiles from the 1000 FFP8 simulations processed by the Commander method. Lower panel: mean-subtracted and inverse-variance-weighted local-variance map for the 8° discs and for the Commander component-separation method; each pixel is given in terms of the lower- and upper-tail probability of the measured value on that pixel compared to the values from the simulations. The pixels in grey correspond to the centres of the 8° discs on which the number of unmasked pixels in the full resolution map is lower than our threshold. The black curve superposed on the map indicates the boundary of the opposing hemispheres along the asymmetry axis. It is clear that the largest fraction of >95% outliers (red pixels) lie on the positive amplitude hemisphere of the local variance dipole, while the <5% outliers (blue pixels) are on the opposite hemisphere. The corresponding maps for NILC, SEVEM, and SMICA are very similar to the one shown here.
Current usage metrics show cumulative count of Article Views (full-text article views including HTML views, PDF and ePub downloads, according to the available data) and Abstracts Views on Vision4Press platform.
Data correspond to usage on the plateform after 2015. The current usage metrics is available 48-96 hours after online publication and is updated daily on week days.
Initial download of the metrics may take a while.