Fig. 27
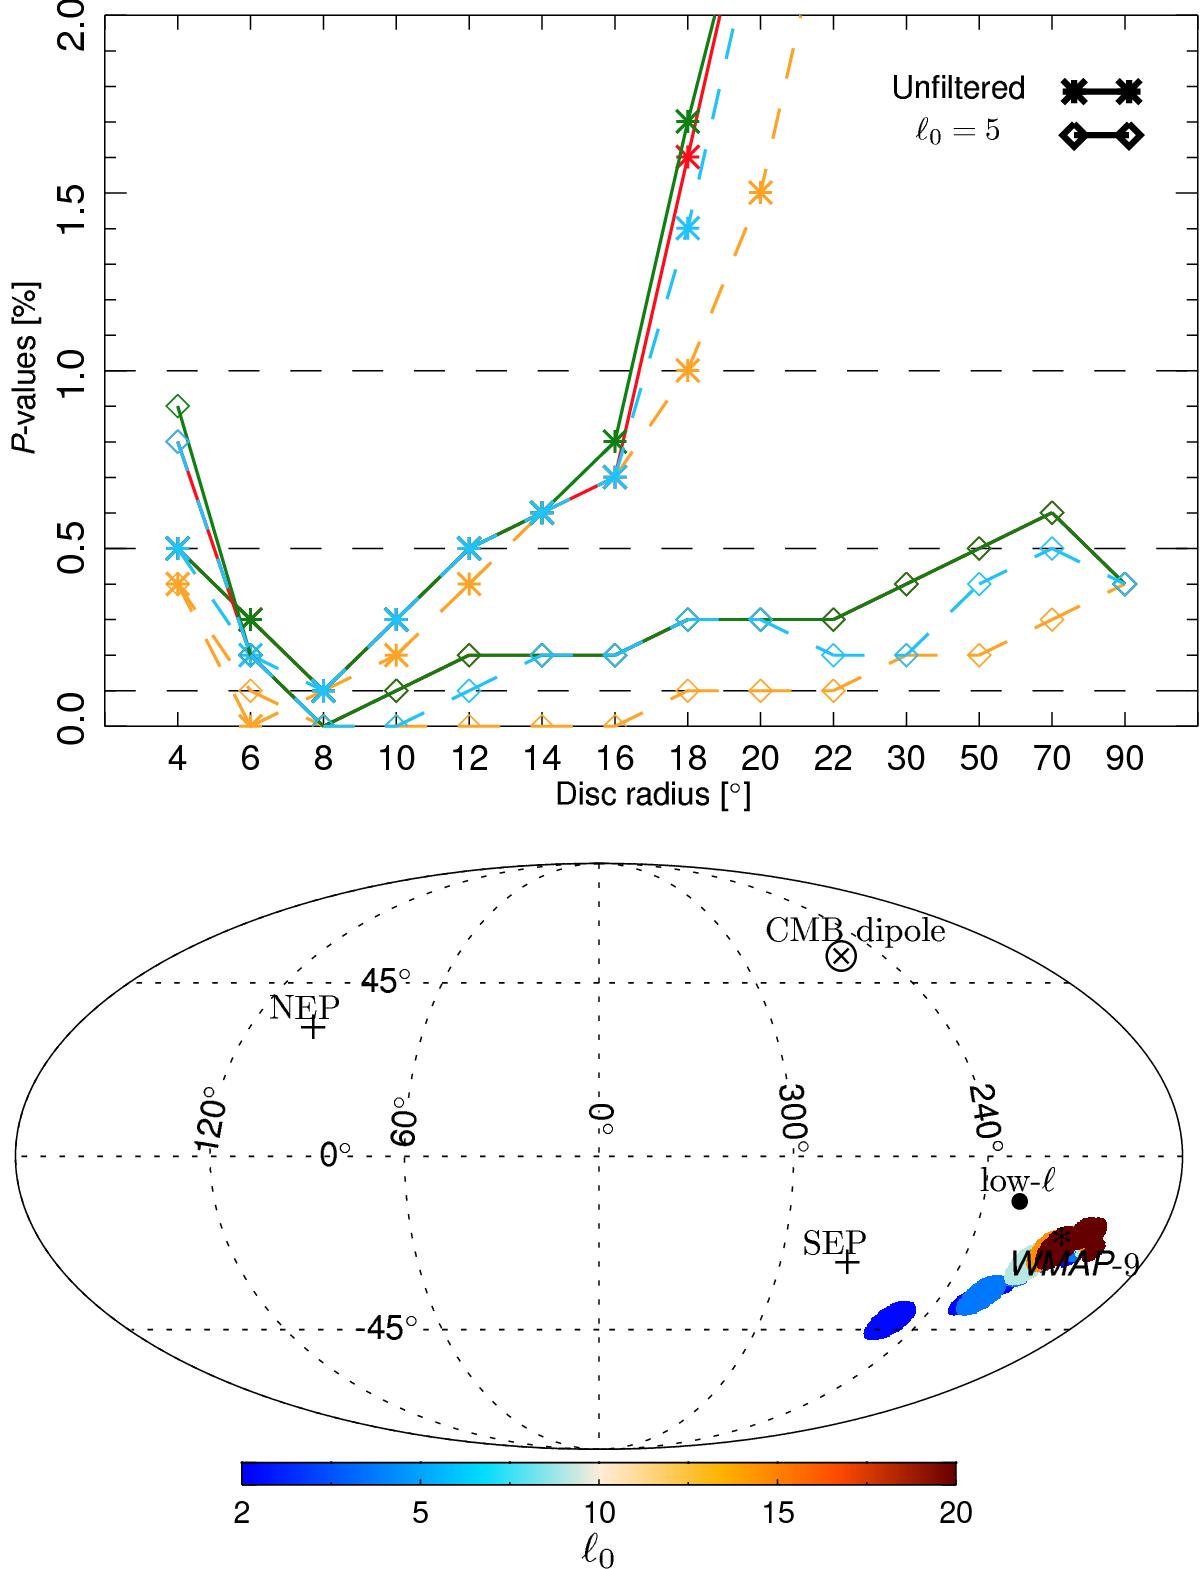
Upper panel: p-values for variance asymmetry measured as the number of simulations with local-variance dipole amplitudes larger than those inferred from the data, as a function of disc radius for the four component-separated maps, Commander (red), NILC (orange), SEVEM (green), and SMICA (blue), and for unfiltered and high-pass-filtered cases. For the filtered case, the Commander curve is covered by the SMICA curve for small (rdisk ≤ 8) disks, and by the SEVEM curve for large disks (rdisk> 8). Lower panel: local-variance dipole directions for the SMICA map. The colours, as indicated by the colourbar, correspond to different values of the high-pass filter central multipole ℓ0. The size of a marker disc corresponds, from small to large, to the size of the disc used in the analysis, namely 4°, 12°, 20°, and 70°. The dipole directions from the Commander, NILC, and SEVEM component-separation methods are consistent with the case shown here. The low-ℓ and WMAP-9 directions are identical to those in Fig. 35.
Current usage metrics show cumulative count of Article Views (full-text article views including HTML views, PDF and ePub downloads, according to the available data) and Abstracts Views on Vision4Press platform.
Data correspond to usage on the plateform after 2015. The current usage metrics is available 48-96 hours after online publication and is updated daily on week days.
Initial download of the metrics may take a while.