Fig. 26
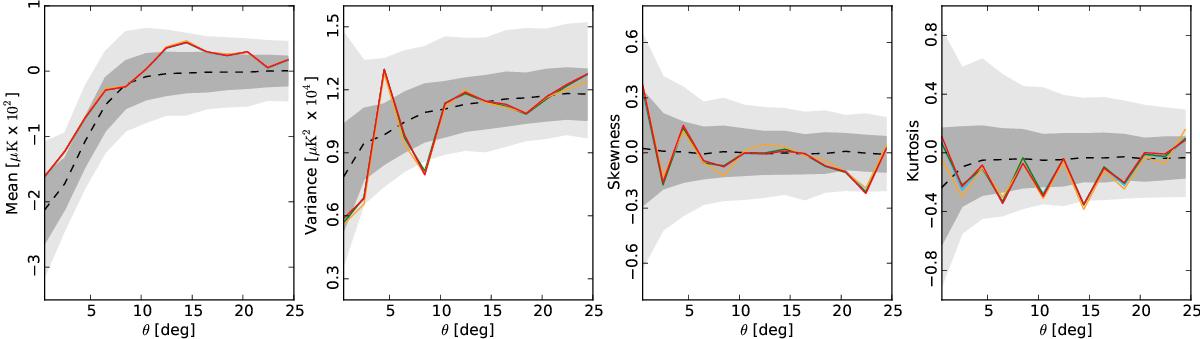
From left to right: mean, variance, skewness, and kurtosis angular profiles computed for rings at radii θ centred on the Cold Spot position for Commander (red), NILC (orange), SEVEM (green), and SMICA (blue). The expected value obtained from the simulations is denoted by the black dashed line and the dark and light grey regions represent the 1σ and 2σ intervals.
Current usage metrics show cumulative count of Article Views (full-text article views including HTML views, PDF and ePub downloads, according to the available data) and Abstracts Views on Vision4Press platform.
Data correspond to usage on the plateform after 2015. The current usage metrics is available 48-96 hours after online publication and is updated daily on week days.
Initial download of the metrics may take a while.