Fig. 25
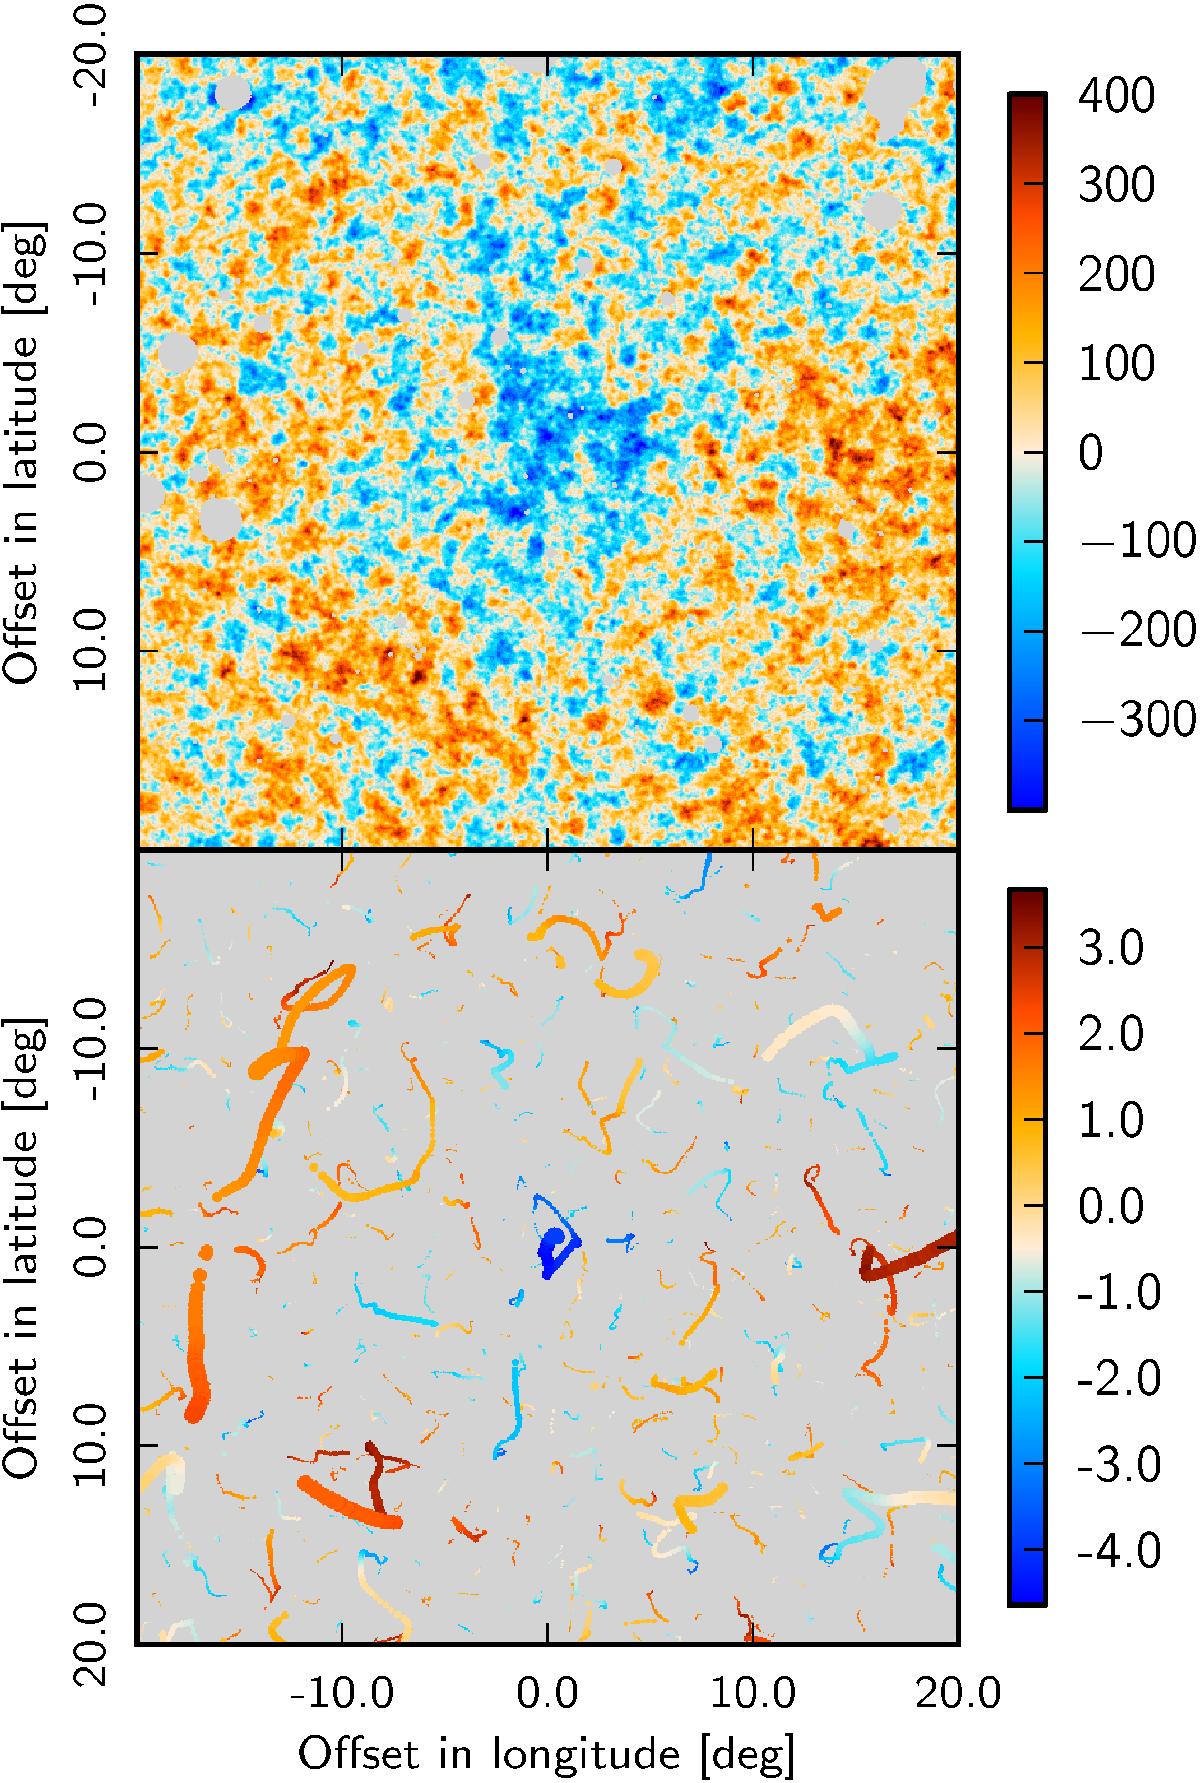
Top: temperature patch centred on the Cold Spot. Bottom: peak merger tree within the Cold Spot region. The figure shows a region centred on the Cold Spot location in gnomonic projection, with all the peaks in SSG84-filtered maps with FWHM ranging from 80′ to 1200′ overlaid on the same plot. The size of the coloured circles is proportional to the filtering scale. The colour corresponds to the peak value, normalized in units of σ for a given filter scale. In both panels the data are from the SMICA CMB map at full resolution.
Current usage metrics show cumulative count of Article Views (full-text article views including HTML views, PDF and ePub downloads, according to the available data) and Abstracts Views on Vision4Press platform.
Data correspond to usage on the plateform after 2015. The current usage metrics is available 48-96 hours after online publication and is updated daily on week days.
Initial download of the metrics may take a while.