Free Access
Fig. 24
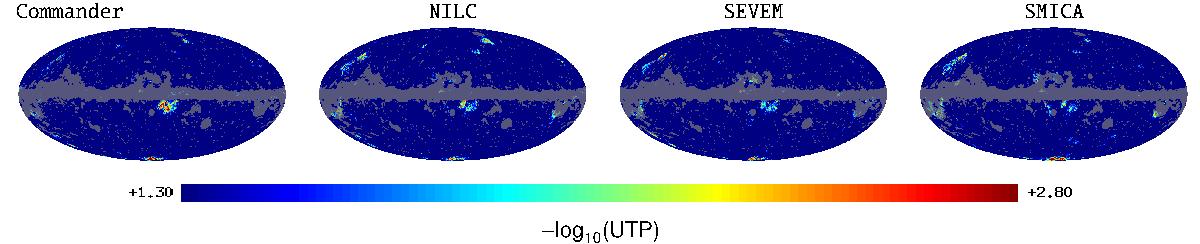
Map of −log 10(UTP) for the two-sample KS-deviation where each pixel encodes the probability determined for a 30° diameter disc centred on it, as computed from the Planck 40′ GAUSS-filtered temperature data.
Current usage metrics show cumulative count of Article Views (full-text article views including HTML views, PDF and ePub downloads, according to the available data) and Abstracts Views on Vision4Press platform.
Data correspond to usage on the plateform after 2015. The current usage metrics is available 48-96 hours after online publication and is updated daily on week days.
Initial download of the metrics may take a while.