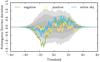
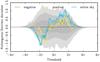
Fig. 22
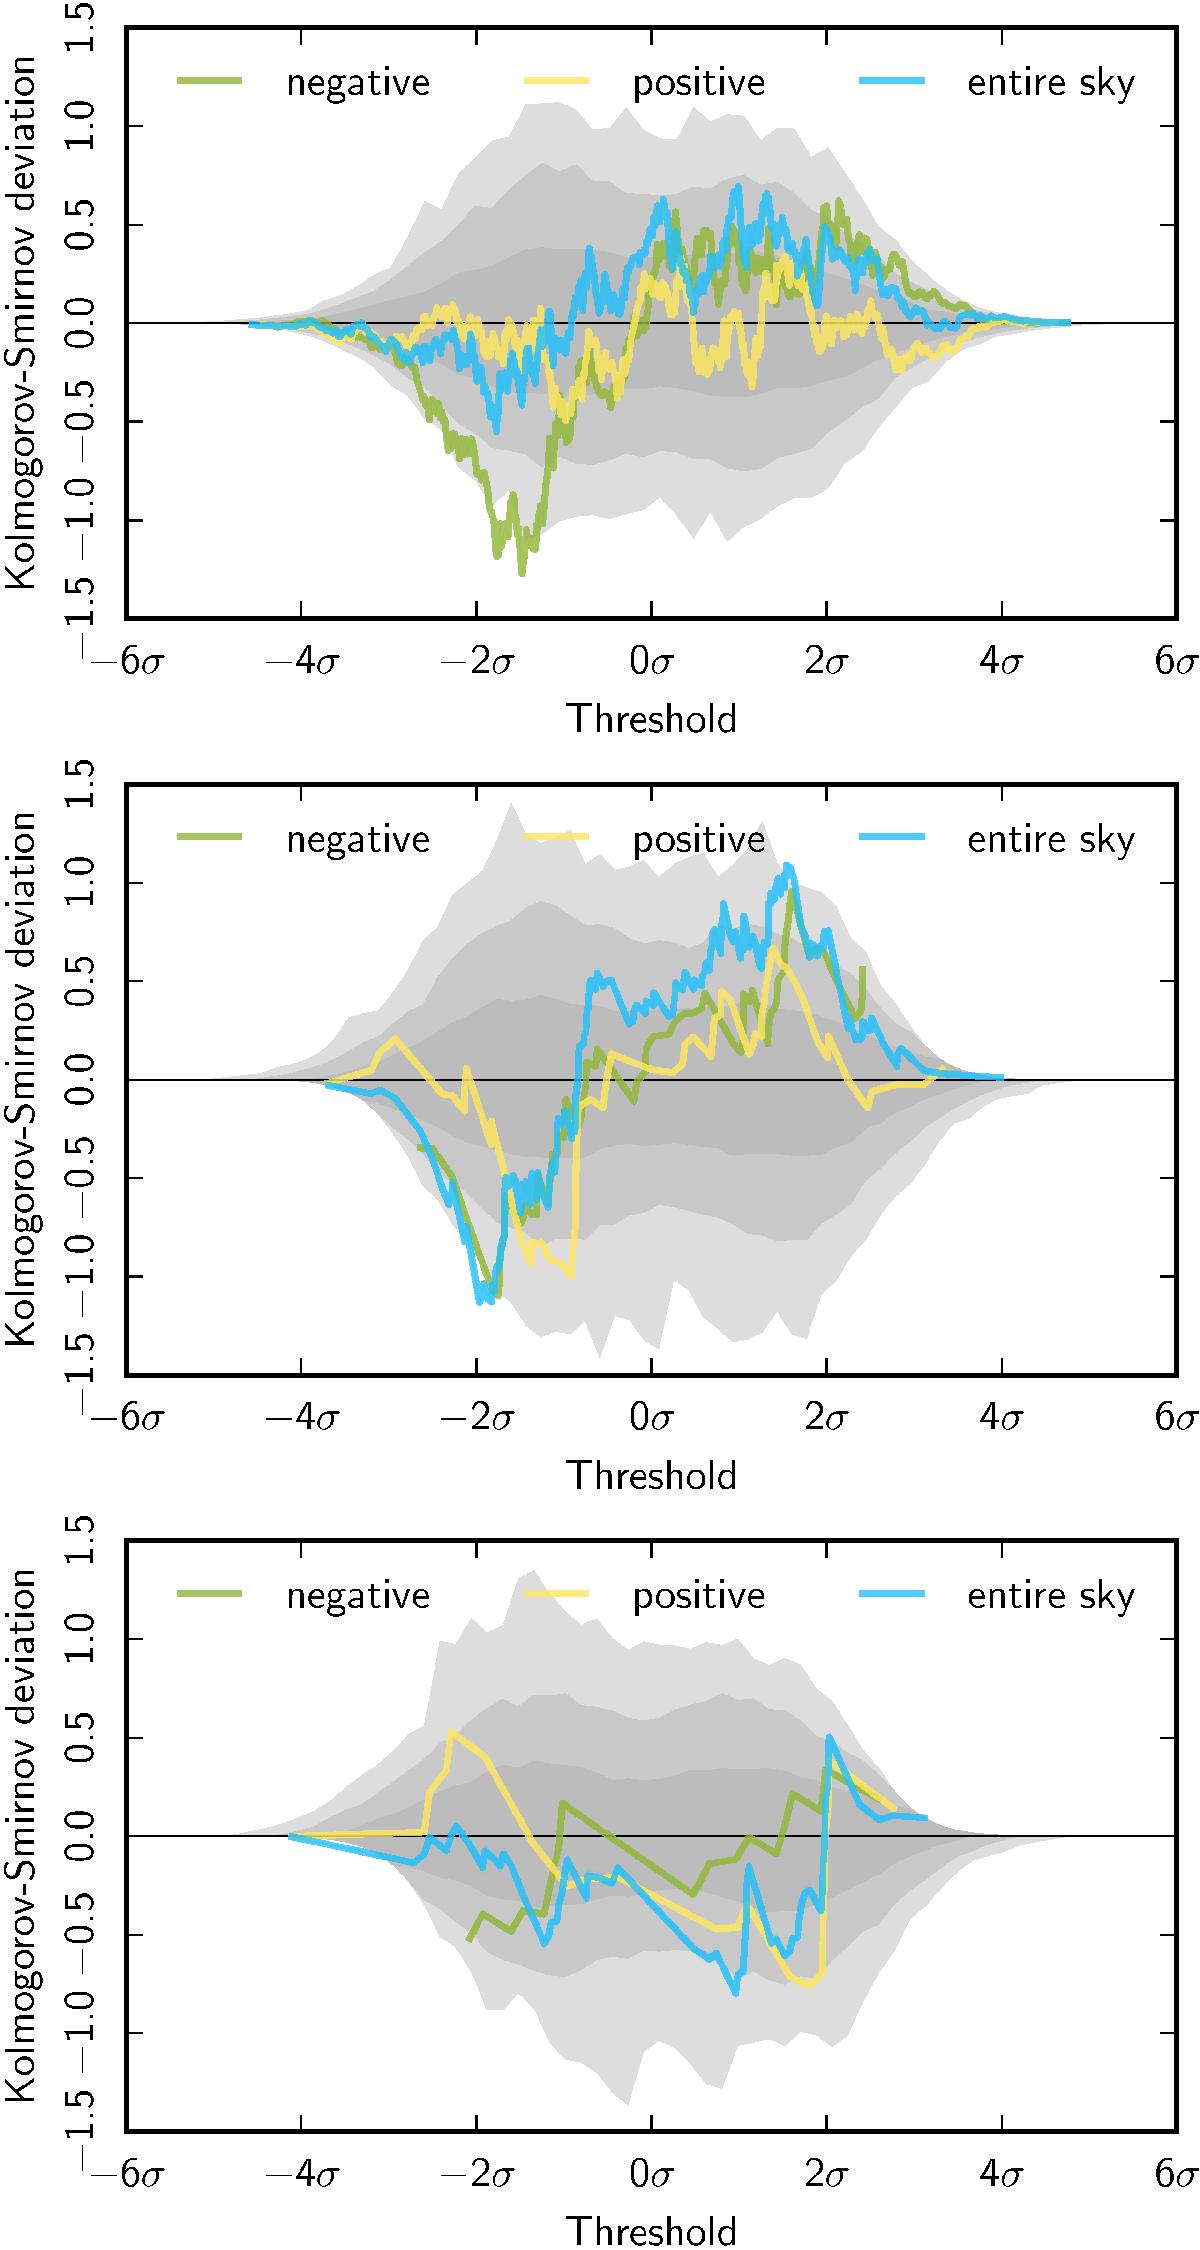
KS-deviation of the peak distribution for 70° radius discs centred on the positive and negative asymmetry directions determined from the SMICA CMB temperature map in Sect. 6.2. From top to bottom, the plots correspond to maps filtered with a GAUSS kernel of 40′ FWHM, an SSG84 filter of 500′ FWHM, and an SSG84 filter of 800′ FWHM, respectively.
Current usage metrics show cumulative count of Article Views (full-text article views including HTML views, PDF and ePub downloads, according to the available data) and Abstracts Views on Vision4Press platform.
Data correspond to usage on the plateform after 2015. The current usage metrics is available 48-96 hours after online publication and is updated daily on week days.
Initial download of the metrics may take a while.