Free Access
Fig. 21
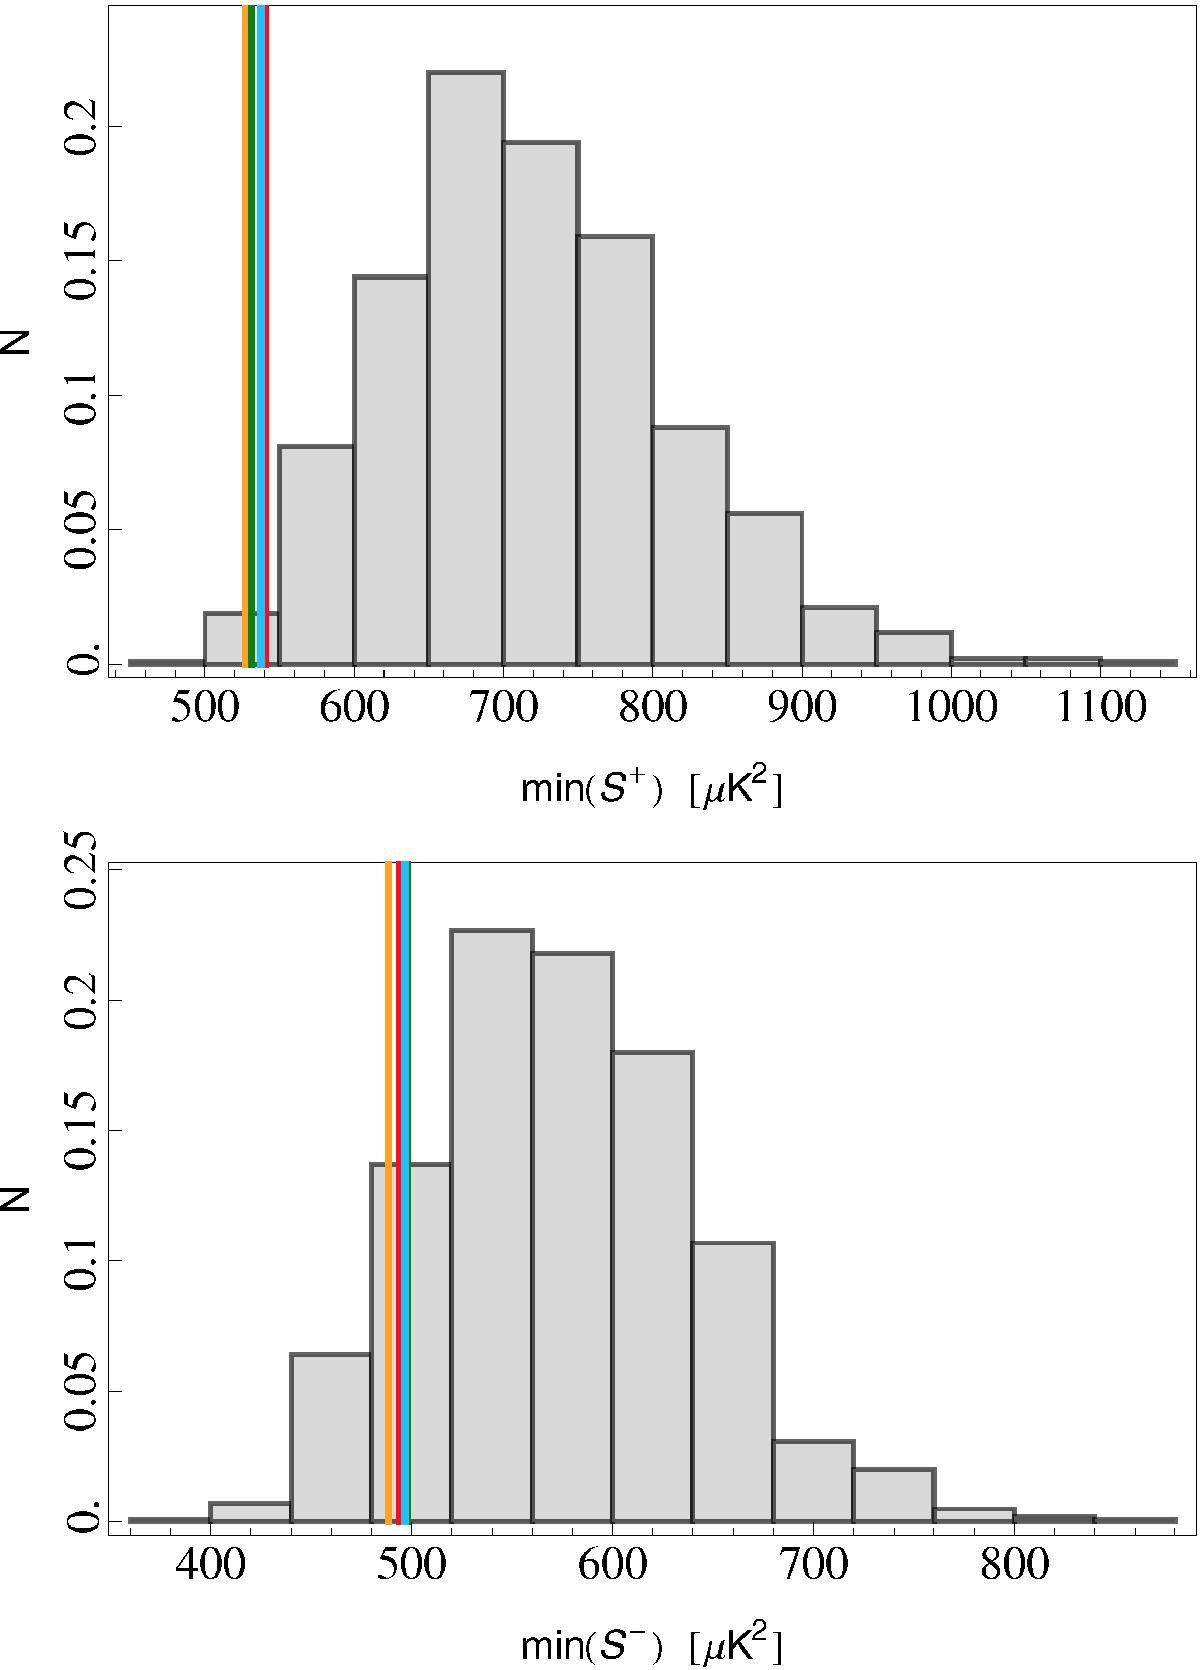
Histograms of the S+ (top panel) and S− (bottom panel) statistic. The vertical lines show the minimum value for the estimator computed at Nside = 32 for Commander (red), NILC (orange), SEVEM (green), and SMICA (blue) maps. The grey area shows the same quantity computed from 1000 simulated SMICA maps.
This figure is made of several images, please see below:
Current usage metrics show cumulative count of Article Views (full-text article views including HTML views, PDF and ePub downloads, according to the available data) and Abstracts Views on Vision4Press platform.
Data correspond to usage on the plateform after 2015. The current usage metrics is available 48-96 hours after online publication and is updated daily on week days.
Initial download of the metrics may take a while.