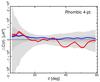
Fig. 17
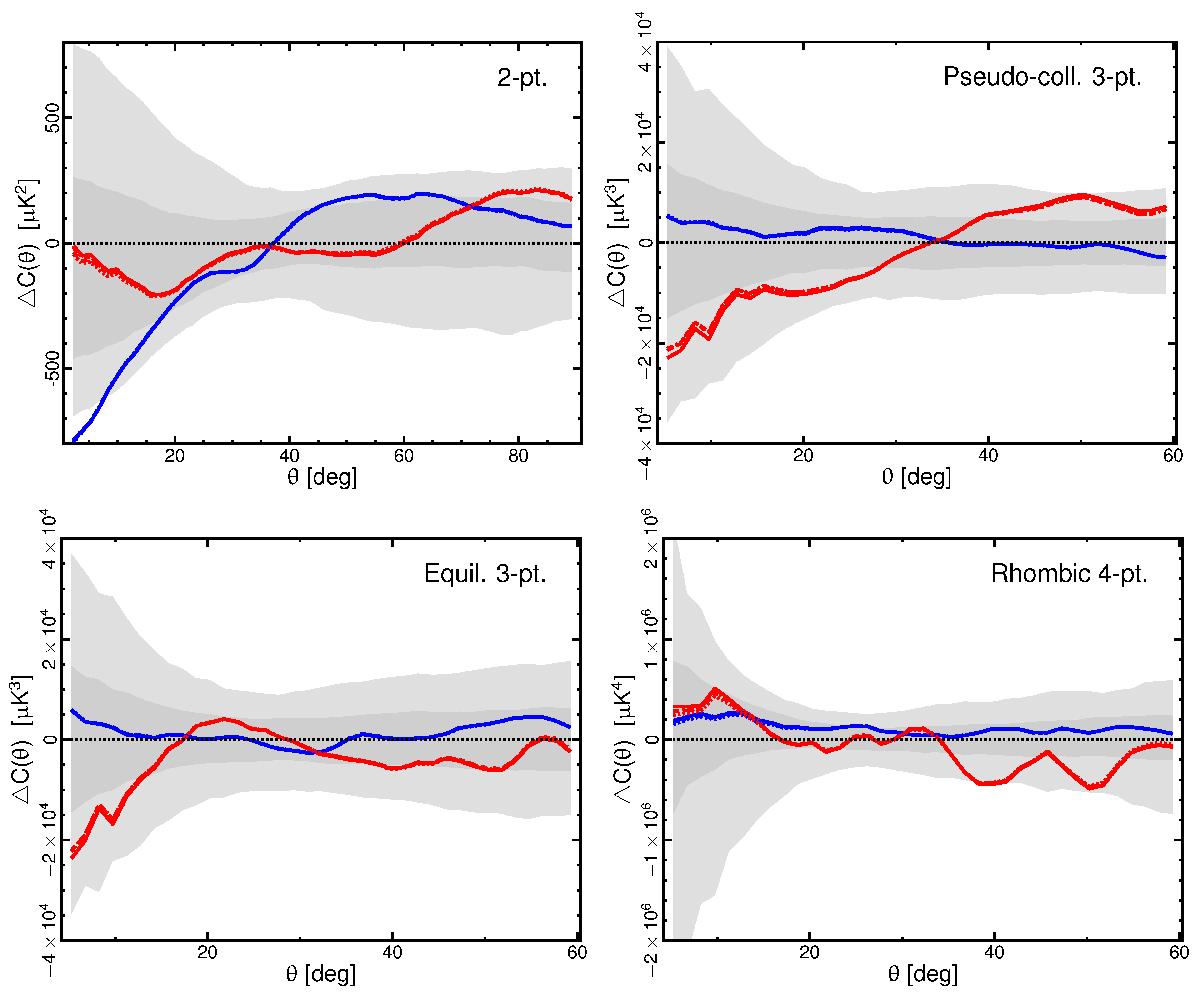
Difference of the N-point correlation functions determined from the Nside = 64Planck CMB 2015 temperature estimates and the corresponding means estimated from 1000 simulations. Results are shown for the 2-point, pseudo-collapsed 3-point (upper left and right panels, respectively), equilateral 3-point, and connected rhombic 4-point functions (lower left and right panels, respectively). Correlation functions are shown for the analysis performed on northern (blue) and southern (red) hemispheres determined in the ecliptic coordinate frame. The solid, dashed, dot-dashed, and dotted lines correspond to the Commander, NILC, SEVEM, and SMICA maps, respectively. Note that the lines lie on top of each other. The shaded dark and light grey regions indicate, for reference, the 68% and 95% confidence regions, respectively, determined from the SMICA simulations.
Current usage metrics show cumulative count of Article Views (full-text article views including HTML views, PDF and ePub downloads, according to the available data) and Abstracts Views on Vision4Press platform.
Data correspond to usage on the plateform after 2015. The current usage metrics is available 48-96 hours after online publication and is updated daily on week days.
Initial download of the metrics may take a while.