Free Access
Fig. 15
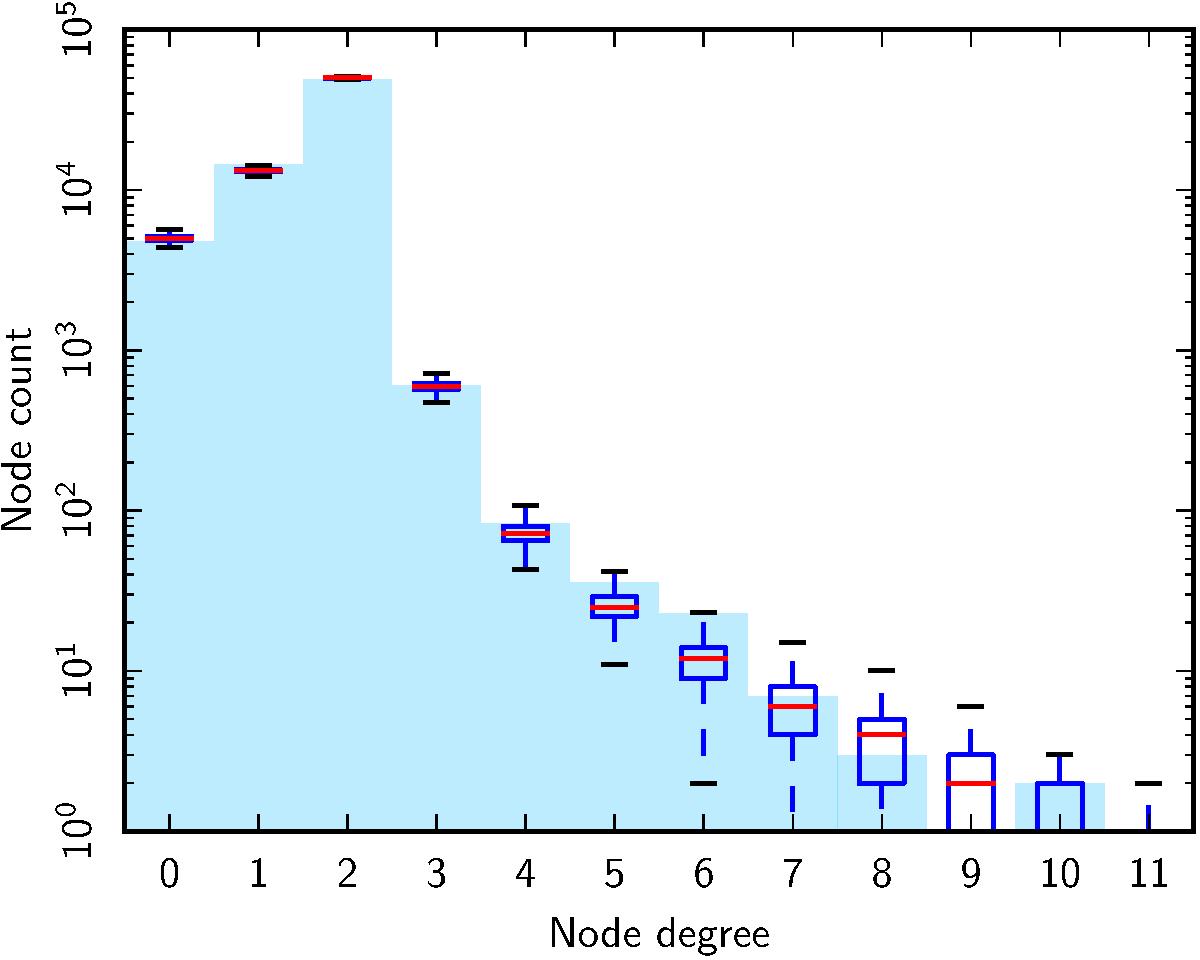
Distribution of node degrees in the multiscale peak linkage graph determined for the SMICA map (cyan), compared with the median (red line), first to third quartile (blue box), and 95% (whiskers) derived from 1000 FFP8 simulations.
Current usage metrics show cumulative count of Article Views (full-text article views including HTML views, PDF and ePub downloads, according to the available data) and Abstracts Views on Vision4Press platform.
Data correspond to usage on the plateform after 2015. The current usage metrics is available 48-96 hours after online publication and is updated daily on week days.
Initial download of the metrics may take a while.