Fig. 11
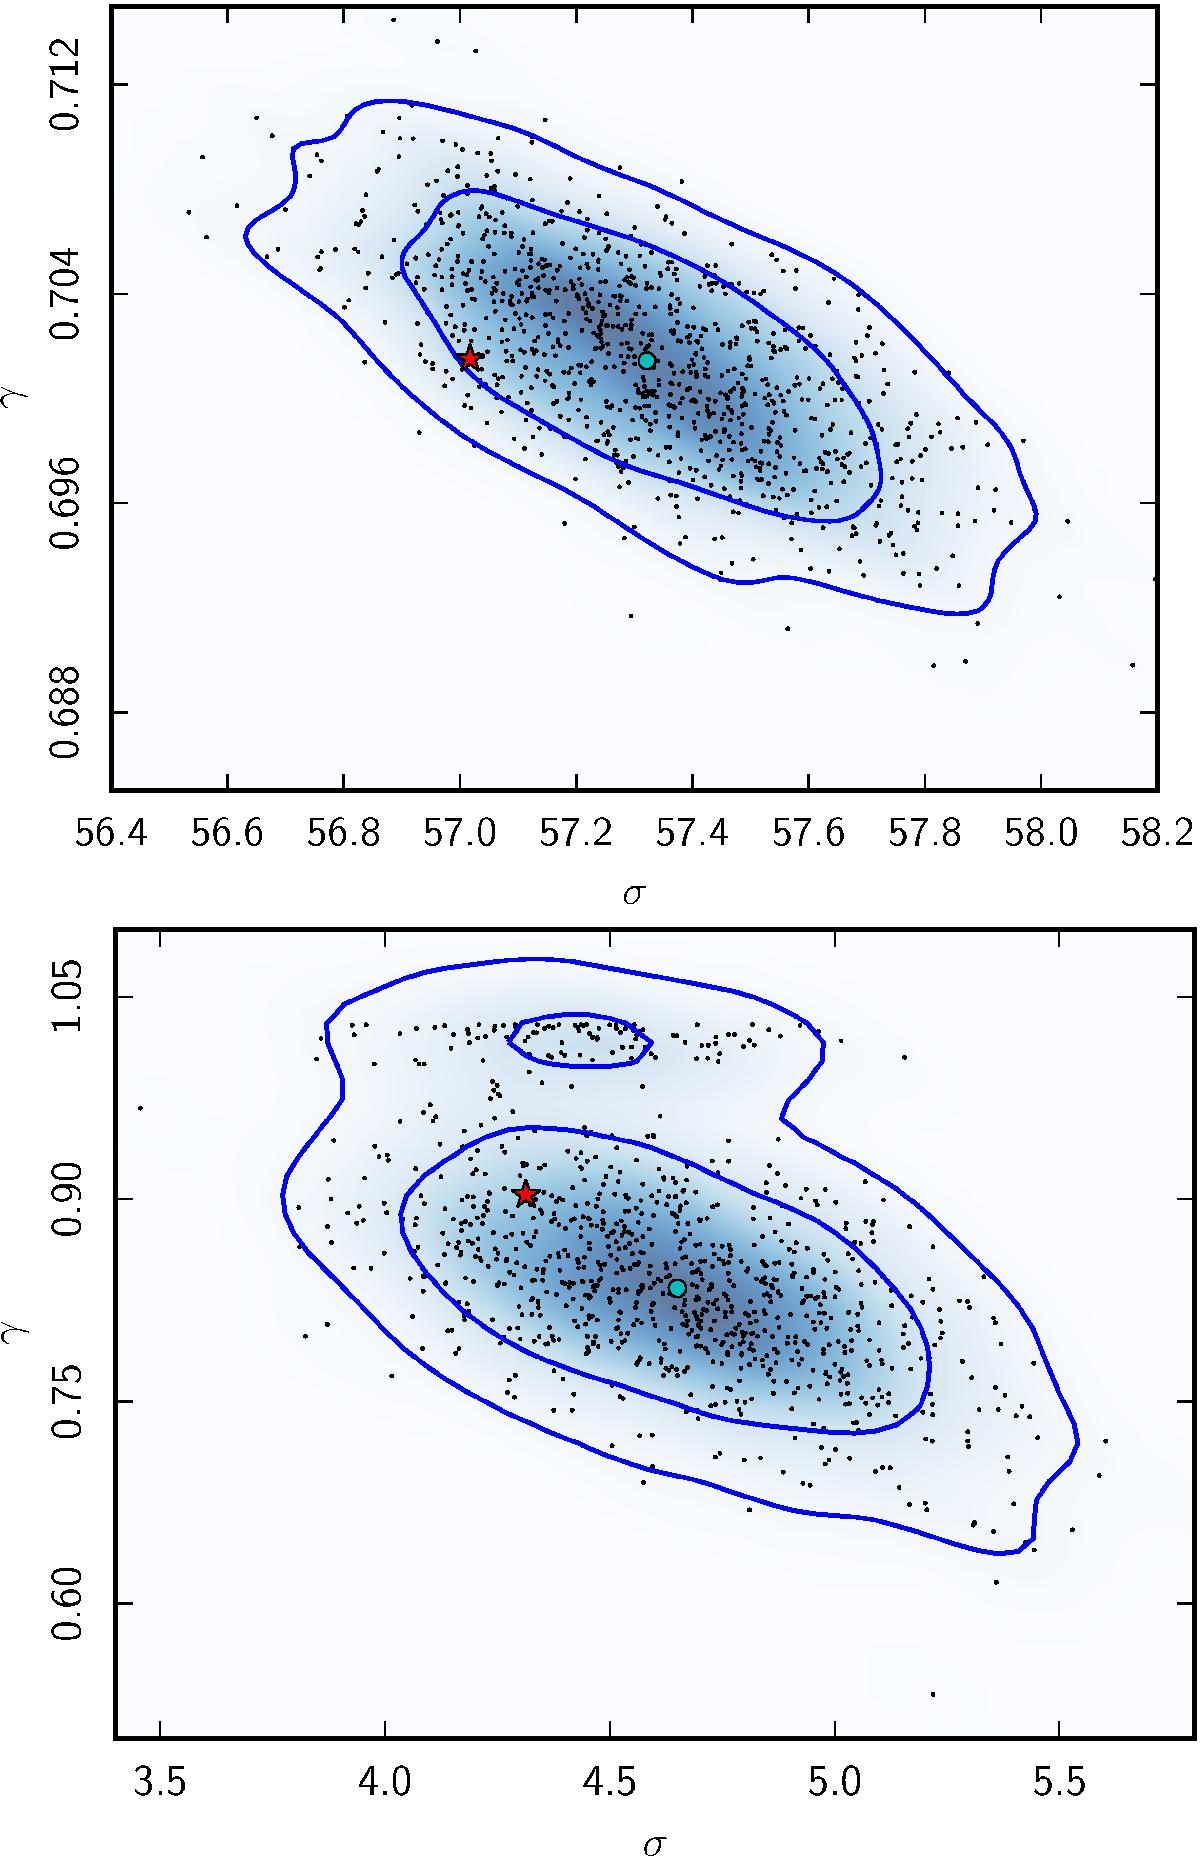
Distribution of best-fit Gaussian peak CDF spectral shape parameters, σ and γ (as defined in Eq. (27)), recovered from 1000 simulations, as indicated by the black dots and the smoothed density map and compared to those derived for the observed sky (shown by the red star). The blue contours enclose 68% and 95% of the parameter distribution, and the cyan circle represents the best-fit parameters for the median peak CDF determined from simulations. The upper panel shows the peak CDF parameters for the SMICA map filtered with a GAUSS kernel of 40′ FWHM. The lower panel shows the corresponding peak CDF for an SSG84 kernel of 800′ FWHM. Similar results are obtained for the other component-separation methods.
Current usage metrics show cumulative count of Article Views (full-text article views including HTML views, PDF and ePub downloads, according to the available data) and Abstracts Views on Vision4Press platform.
Data correspond to usage on the plateform after 2015. The current usage metrics is available 48-96 hours after online publication and is updated daily on week days.
Initial download of the metrics may take a while.