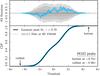
Fig. 10
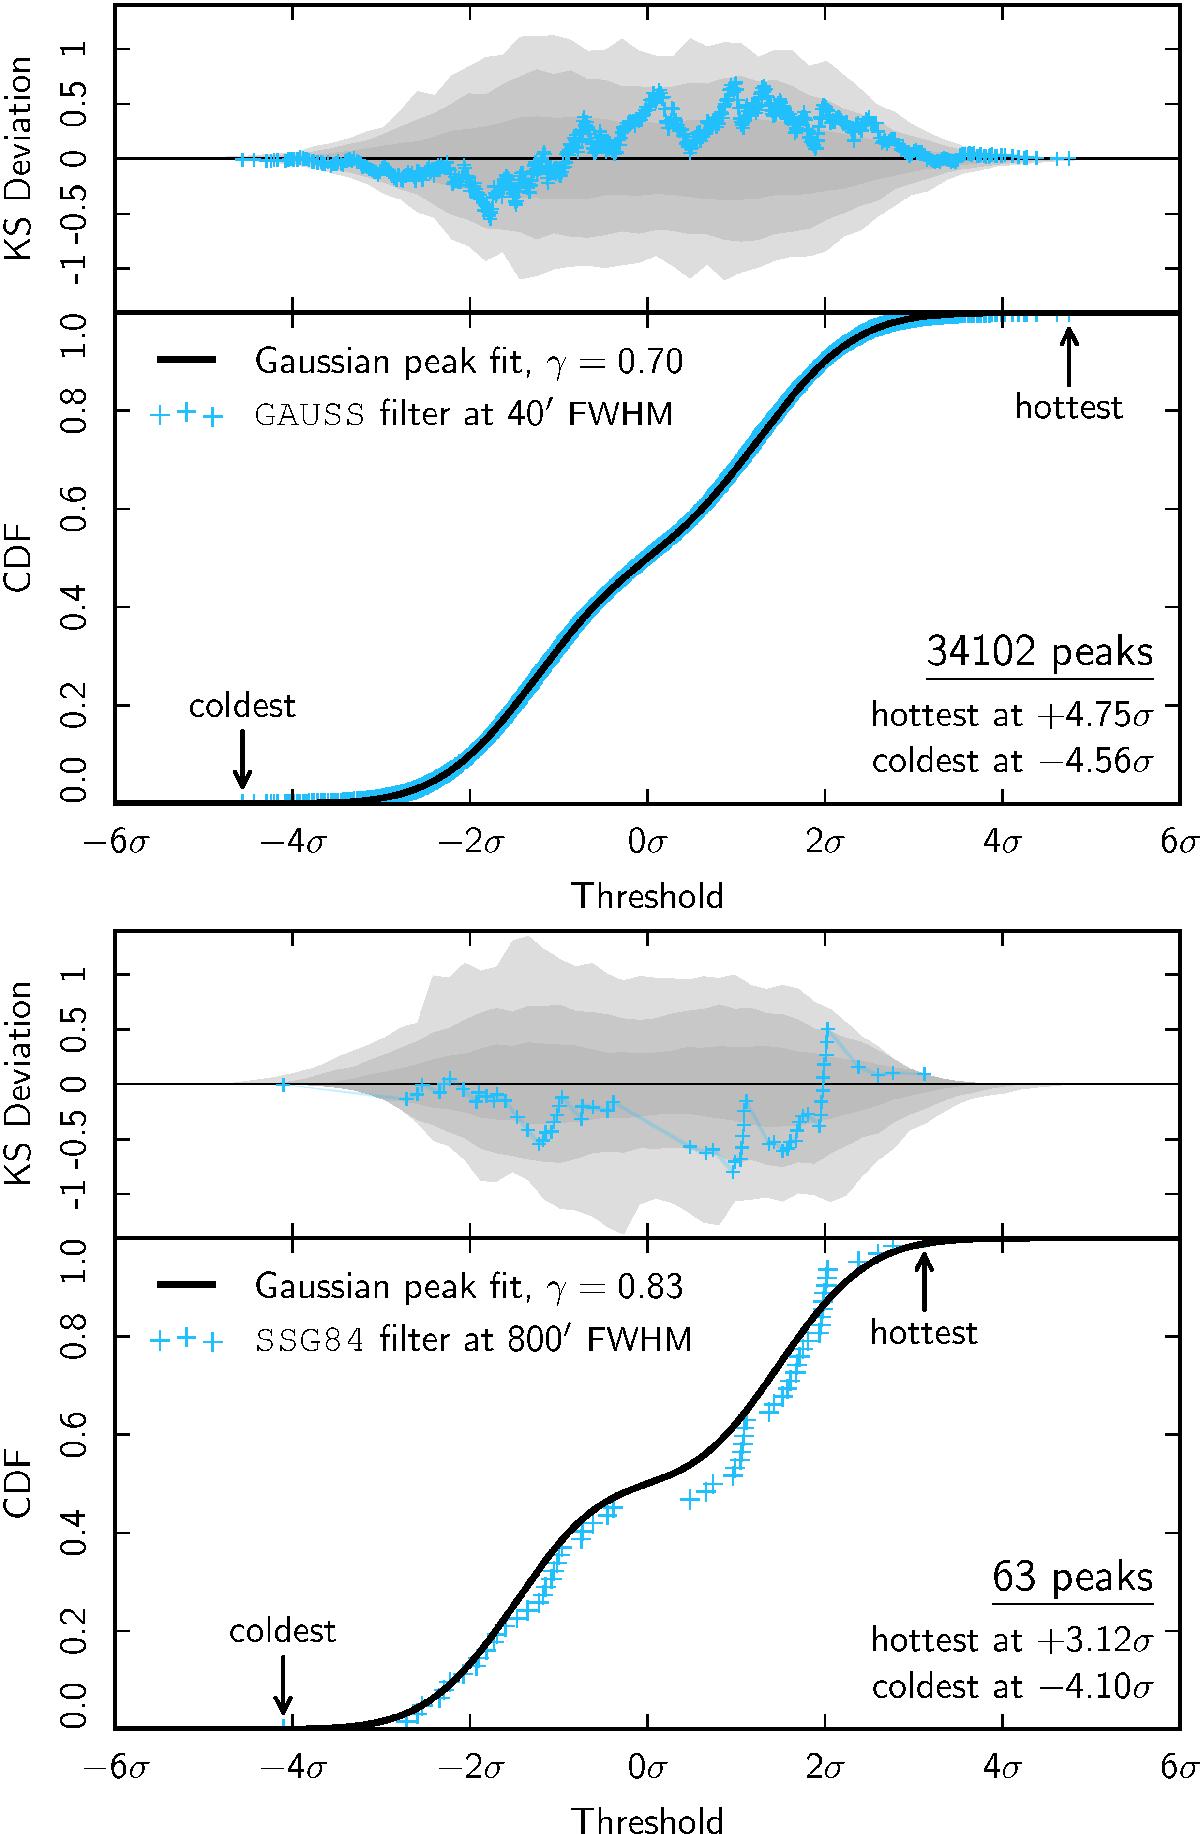
Cumulative density function of the peak distribution for the SMICA CMB temperature map. The top row shows the peak CDF for maps filtered with a GAUSS kernel of 40′ FWHM. The bottom row shows the corresponding peak CDF for an SSG84 kernel of 800′ FWHM. The spectral shape parameter γ (see Eq. (27)) is the best-fit value for the simulated ensemble, as indicated by the cyan circle in Fig. 11. Similar results are obtained for the other component-separation methods.
Current usage metrics show cumulative count of Article Views (full-text article views including HTML views, PDF and ePub downloads, according to the available data) and Abstracts Views on Vision4Press platform.
Data correspond to usage on the plateform after 2015. The current usage metrics is available 48-96 hours after online publication and is updated daily on week days.
Initial download of the metrics may take a while.