Fig. 7
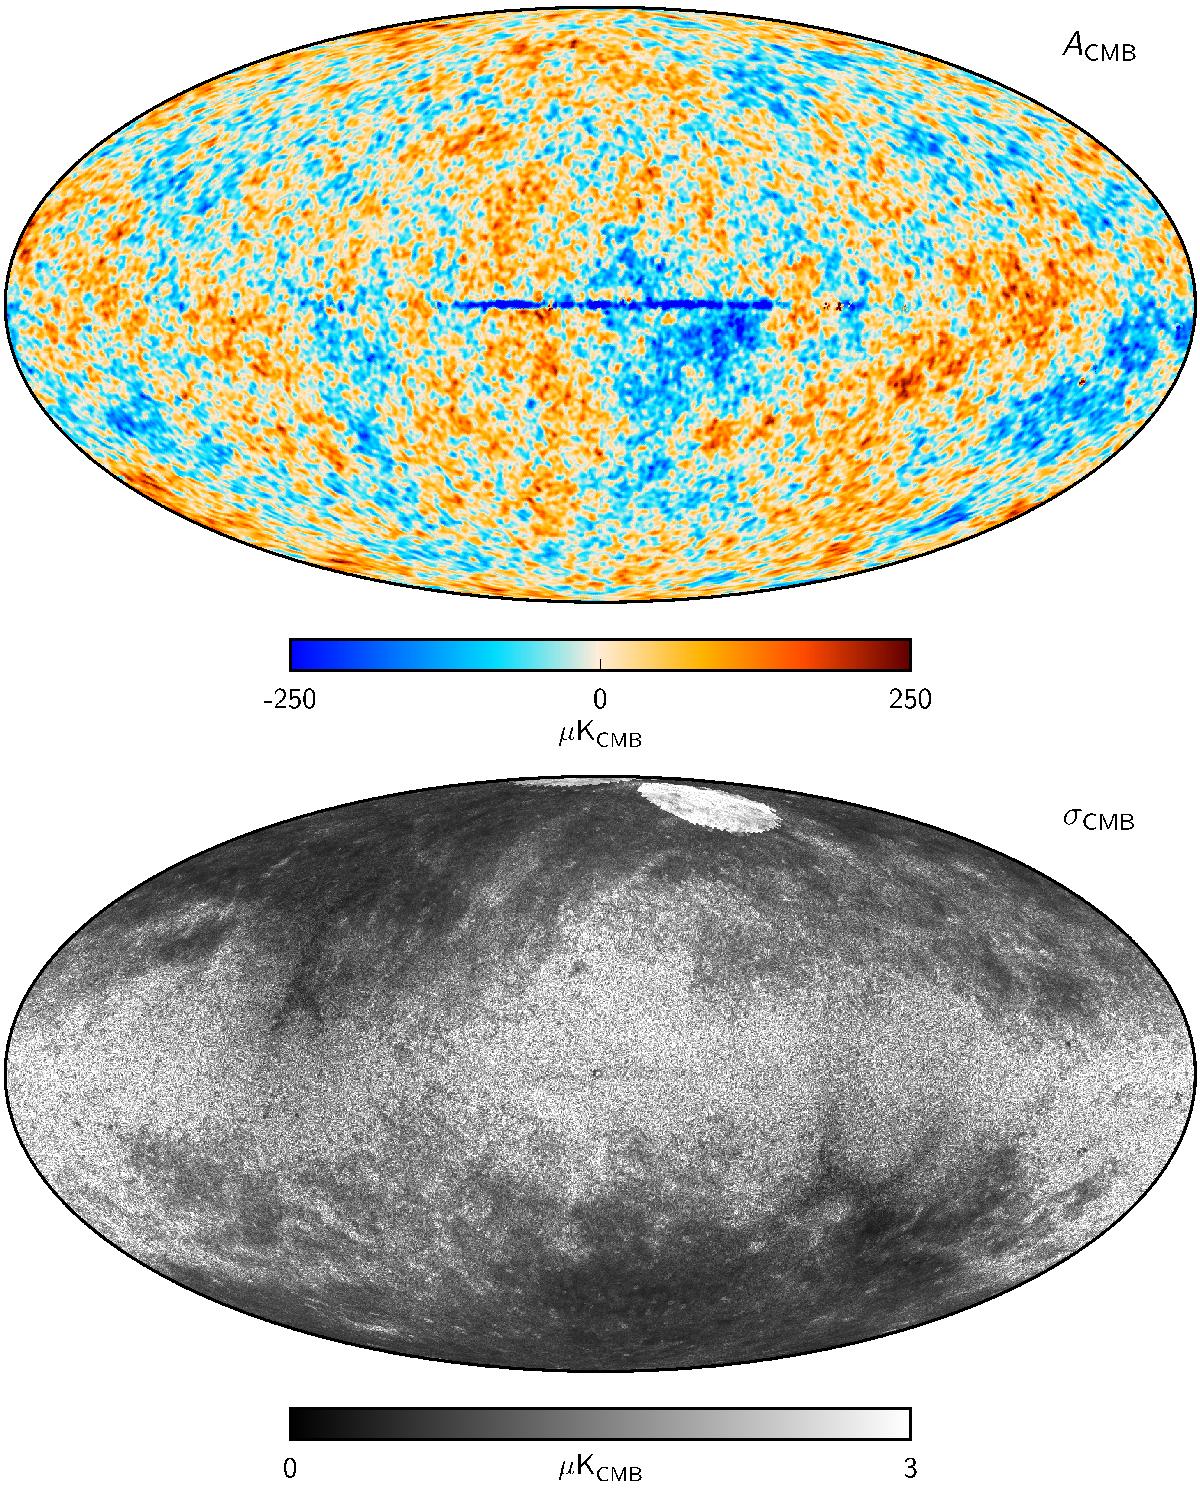
Maximum posterior (top) and posterior rms (bottom) CMB intensity maps derived from the joint baseline analysis of Planck, WMAP, and 408 MHz observations. The two circular regions close to the North Galactic Pole in the rms map correspond to the Coma and Virgo clusters, for which the thermal SZ efect is fitted together with the primary diffuse components. Note also that the rms map includes statistical errors alone, not modelling errors, and they are therefore only meaningful in regions where the corresponding χ2 is acceptable; see Fig. 22. Both panels employ linear colour scales.
Current usage metrics show cumulative count of Article Views (full-text article views including HTML views, PDF and ePub downloads, according to the available data) and Abstracts Views on Vision4Press platform.
Data correspond to usage on the plateform after 2015. The current usage metrics is available 48-96 hours after online publication and is updated daily on week days.
Initial download of the metrics may take a while.