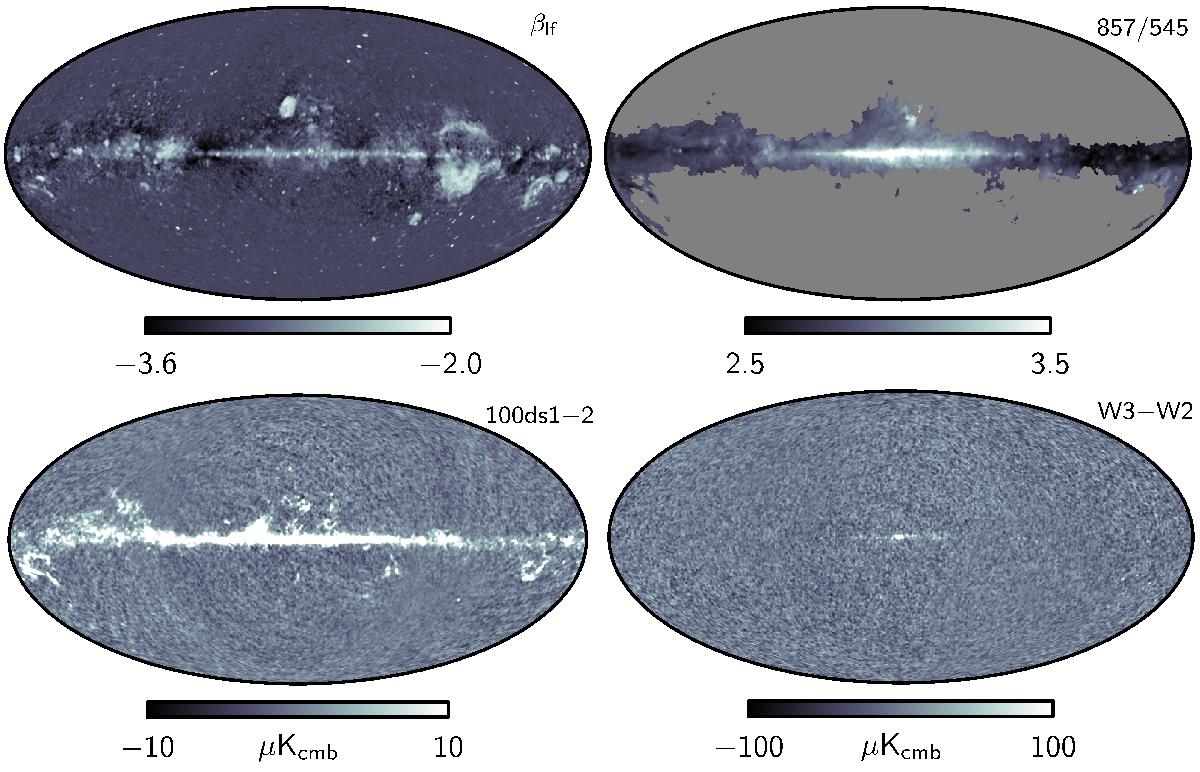
Fig. 6

Top left: effective low-frequency foreground spectral index as measured from the combination of Planck, WMAP, and 408 MHz, with no attempt to disentangle synchrotron, free-free, and spinning dust emission into separate components. However, higher-frequency components (CMB, CO, thermal dust, etc.) are fitted component-by-component, as in the baseline model. Note the very steep spectral indices, βlf ≲ −3.6, near the Galactic plane, with dust-like morphology. These can only be reasonably explained in terms of spinning dust. Top right: ratio between the 857 and 545 GHz frequency maps, smoothed to 1deg FWHM, highlighting the spatially varying temperature of thermal dust. The mask is defined by any region for which the 545 GHz amplitude is smaller than ten times the 545 GHz monopole. Bottom left: difference between the 100-ds1 and 100-ds2 detector maps, smoothed to 1deg, demonstrating the presence of CO J = 1 → 0 emission in these channels. Bottom right: difference between the WMAP W3 and W2 differencing assembly maps, smoothed to 1deg FWHM. The excess signal near the Galactic centre is due to line emission in the 94 GHz channels. The peak amplitude of the difference map is 740μK.
Current usage metrics show cumulative count of Article Views (full-text article views including HTML views, PDF and ePub downloads, according to the available data) and Abstracts Views on Vision4Press platform.
Data correspond to usage on the plateform after 2015. The current usage metrics is available 48-96 hours after online publication and is updated daily on week days.
Initial download of the metrics may take a while.


