Free Access
Fig. 50
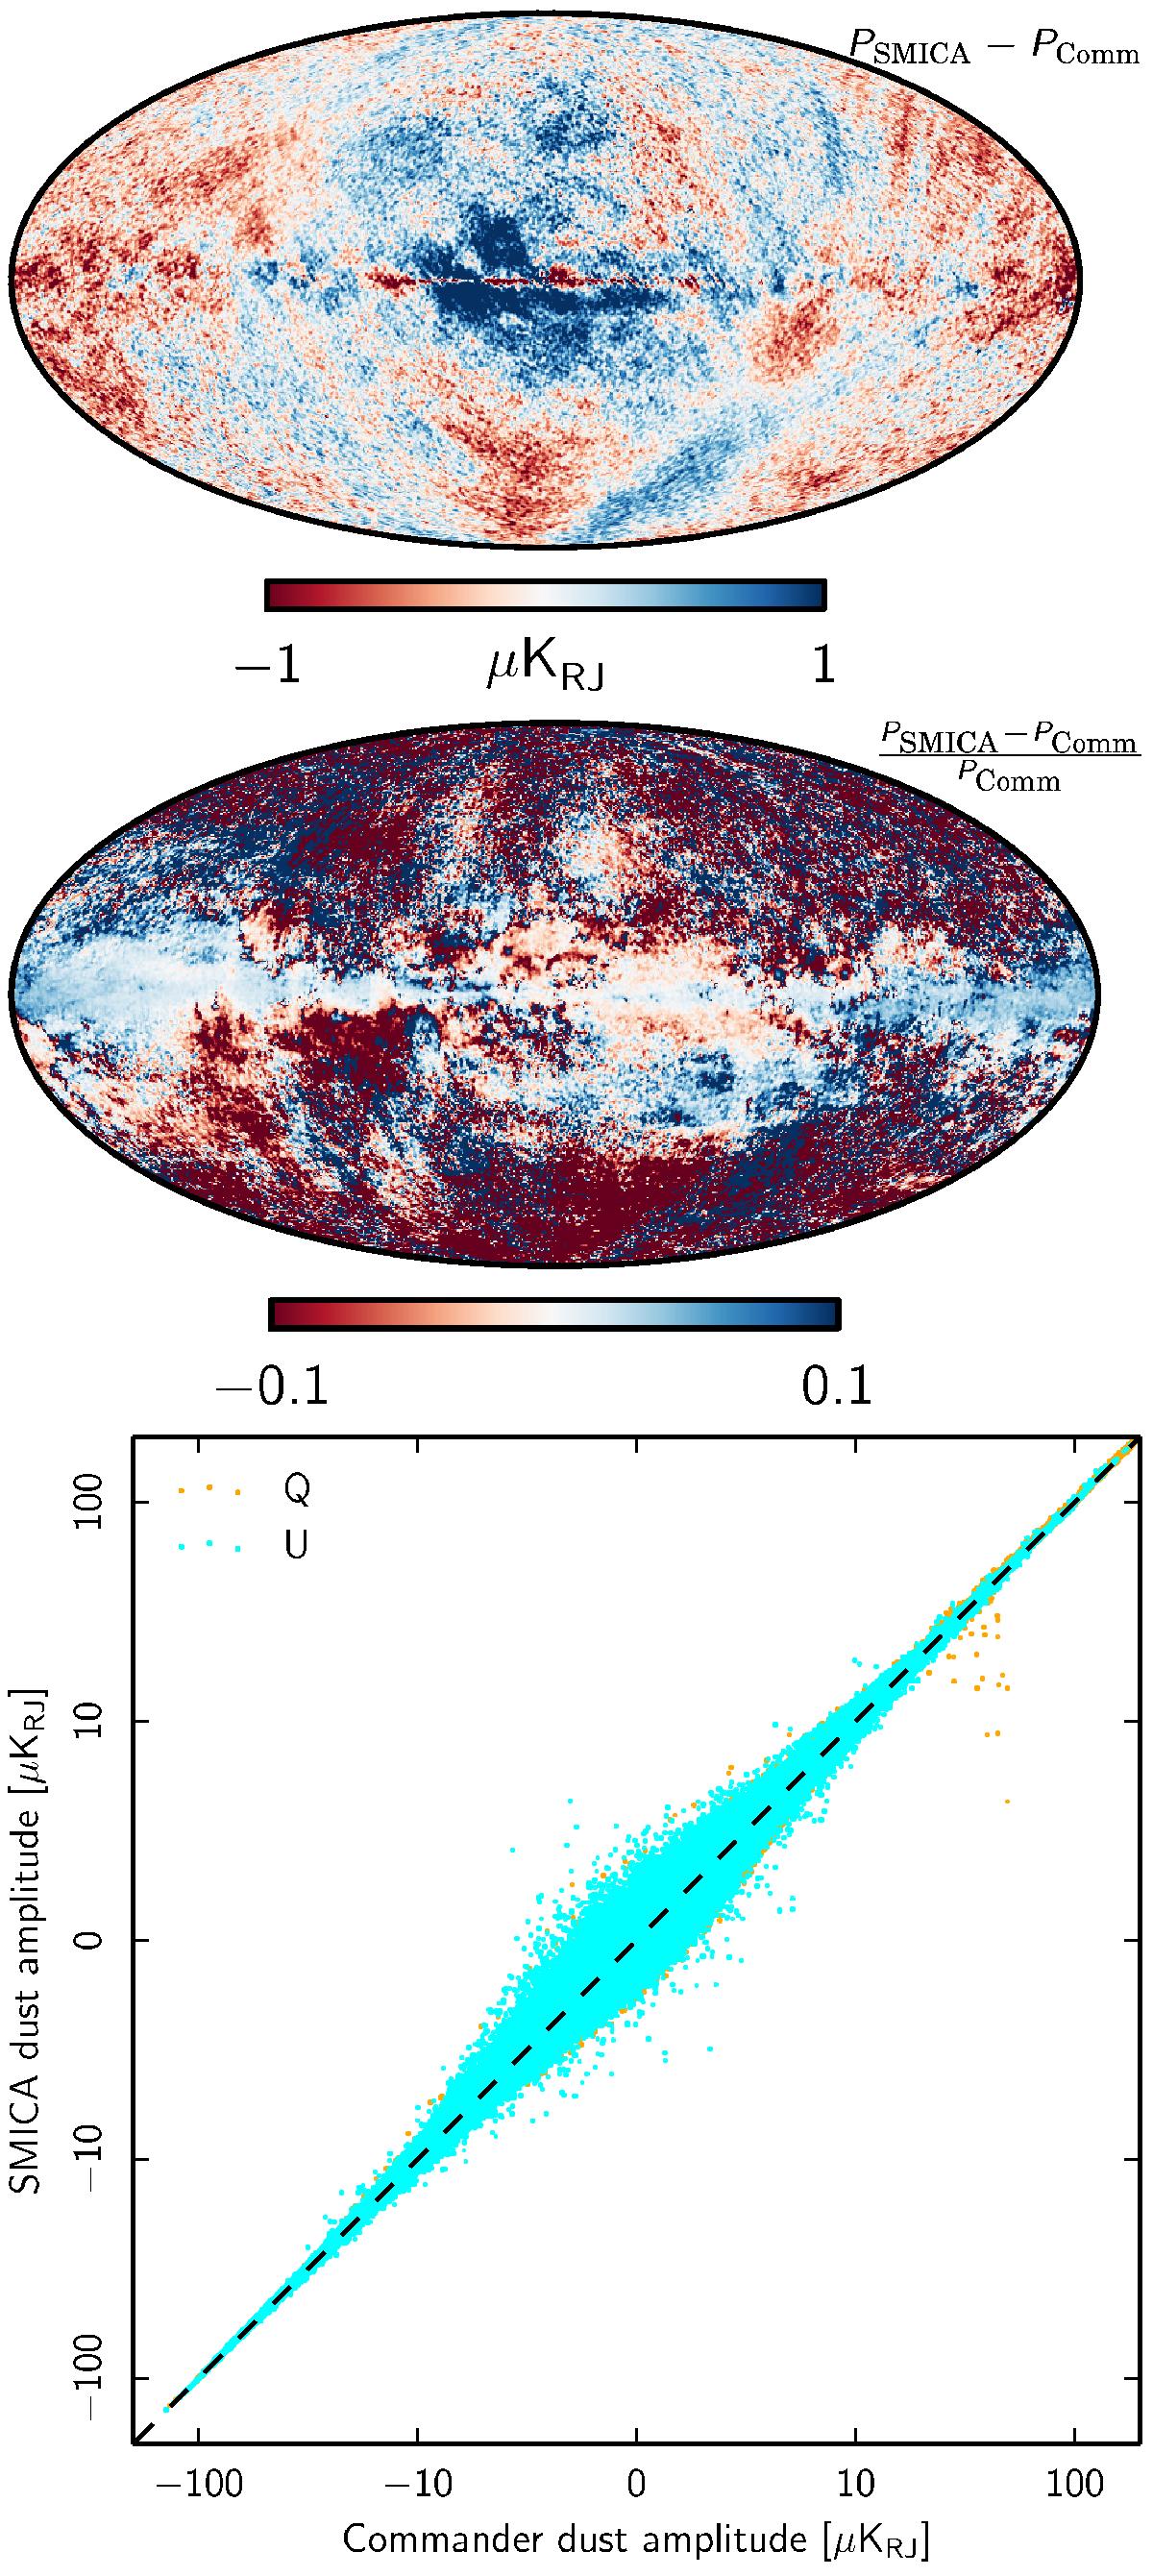
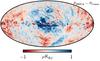
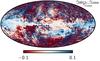
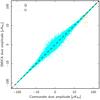
Comparison between the polarized dust amplitude maps, ![]() , derived by SMICA and Commander at 353 GHz. The three panels show the difference map, dSMICA−dComm (top), the fractional difference map, (dSMICA−dComm) /dComm (middle), and a T–T correlation plot. Units are μKRJ.
, derived by SMICA and Commander at 353 GHz. The three panels show the difference map, dSMICA−dComm (top), the fractional difference map, (dSMICA−dComm) /dComm (middle), and a T–T correlation plot. Units are μKRJ.
This figure is made of several images, please see below:
Current usage metrics show cumulative count of Article Views (full-text article views including HTML views, PDF and ePub downloads, according to the available data) and Abstracts Views on Vision4Press platform.
Data correspond to usage on the plateform after 2015. The current usage metrics is available 48-96 hours after online publication and is updated daily on week days.
Initial download of the metrics may take a while.