Free Access
Fig. 48
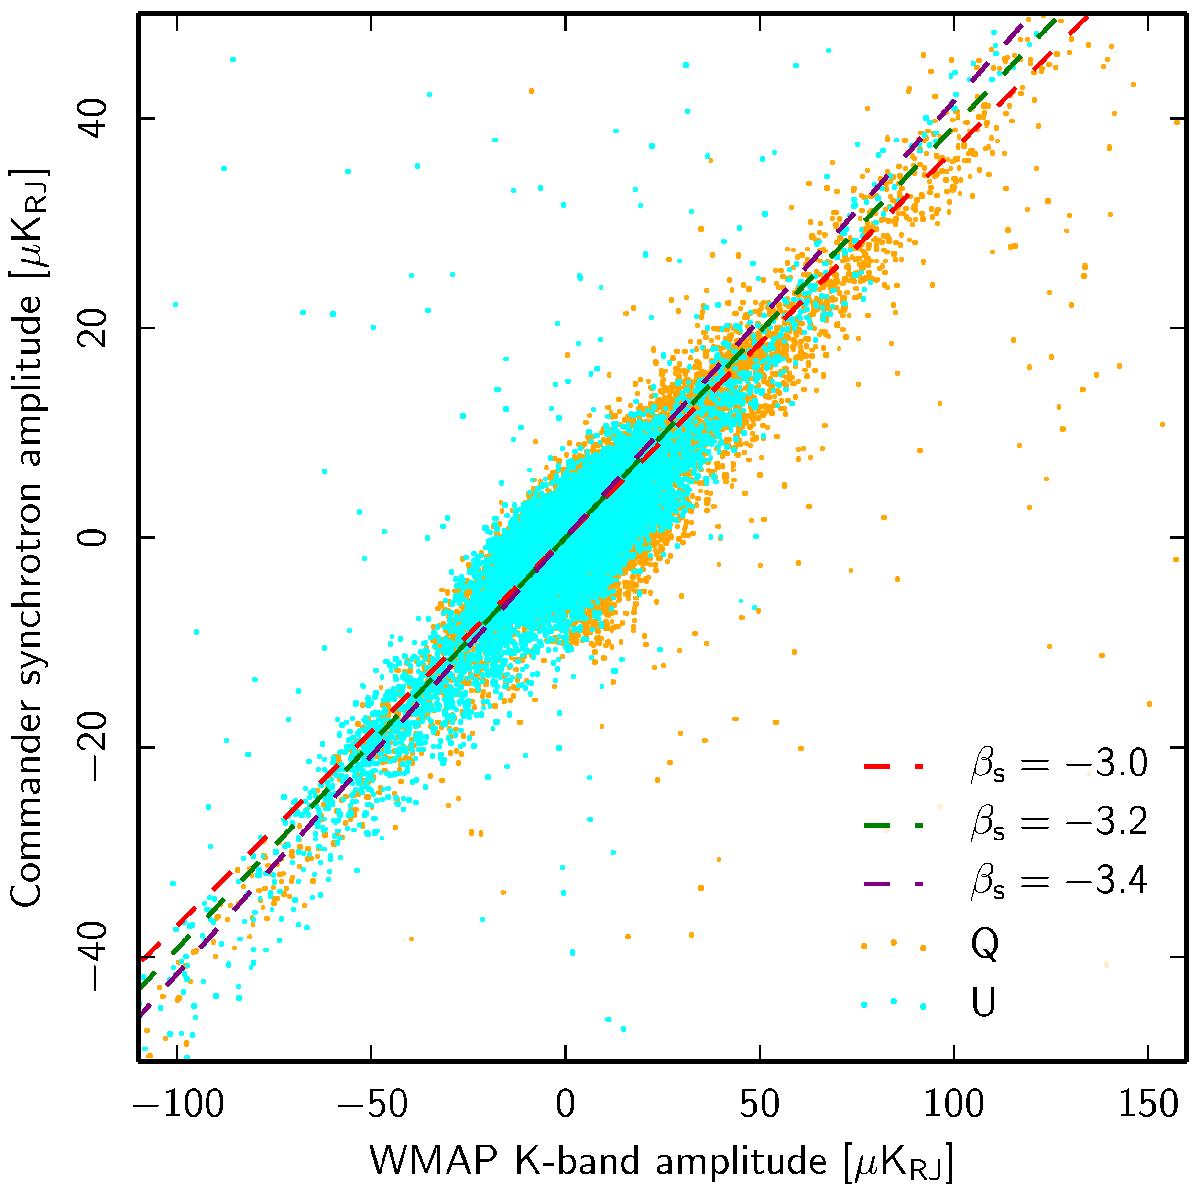
T–T correlation plot between the Planck polarized synchrotron map at 30 GHz and the WMAP K-band map at 23 GHz for both Stokes Q and U parameters. The dashed coloured lines indicate synchrotron spectral indices of βs = −3.0 (red), −3.2 (green) and −3.4 (violet), respectively.
Current usage metrics show cumulative count of Article Views (full-text article views including HTML views, PDF and ePub downloads, according to the available data) and Abstracts Views on Vision4Press platform.
Data correspond to usage on the plateform after 2015. The current usage metrics is available 48-96 hours after online publication and is updated daily on week days.
Initial download of the metrics may take a while.