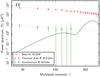
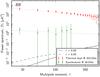
Fig. 44

Angular EE (left panel) and BB (right panel) power spectra for polarized synchrotron (at 30 GHz) and thermal dust emission (at 353 GHz), evaluated with 1deg FWHM apodization and including a total effective sky fraction of 73% of the sky. The dashed lines show the best-fit power-law models to each case, and the solid black lines shows the best-fit ΛCDM power spectrum as fitted to temperature observations only (Planck Collaboration XI 2016; Planck Collaboration XIII 2016). The dashed black line in the BB panel shows the spectrum for a model with a tensor-to-scalar ratio of r = 0.05.
Current usage metrics show cumulative count of Article Views (full-text article views including HTML views, PDF and ePub downloads, according to the available data) and Abstracts Views on Vision4Press platform.
Data correspond to usage on the plateform after 2015. The current usage metrics is available 48-96 hours after online publication and is updated daily on week days.
Initial download of the metrics may take a while.