Free Access
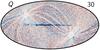
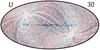
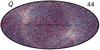
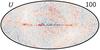
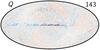
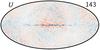
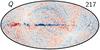
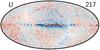
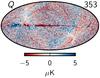
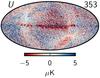
Fig. 40
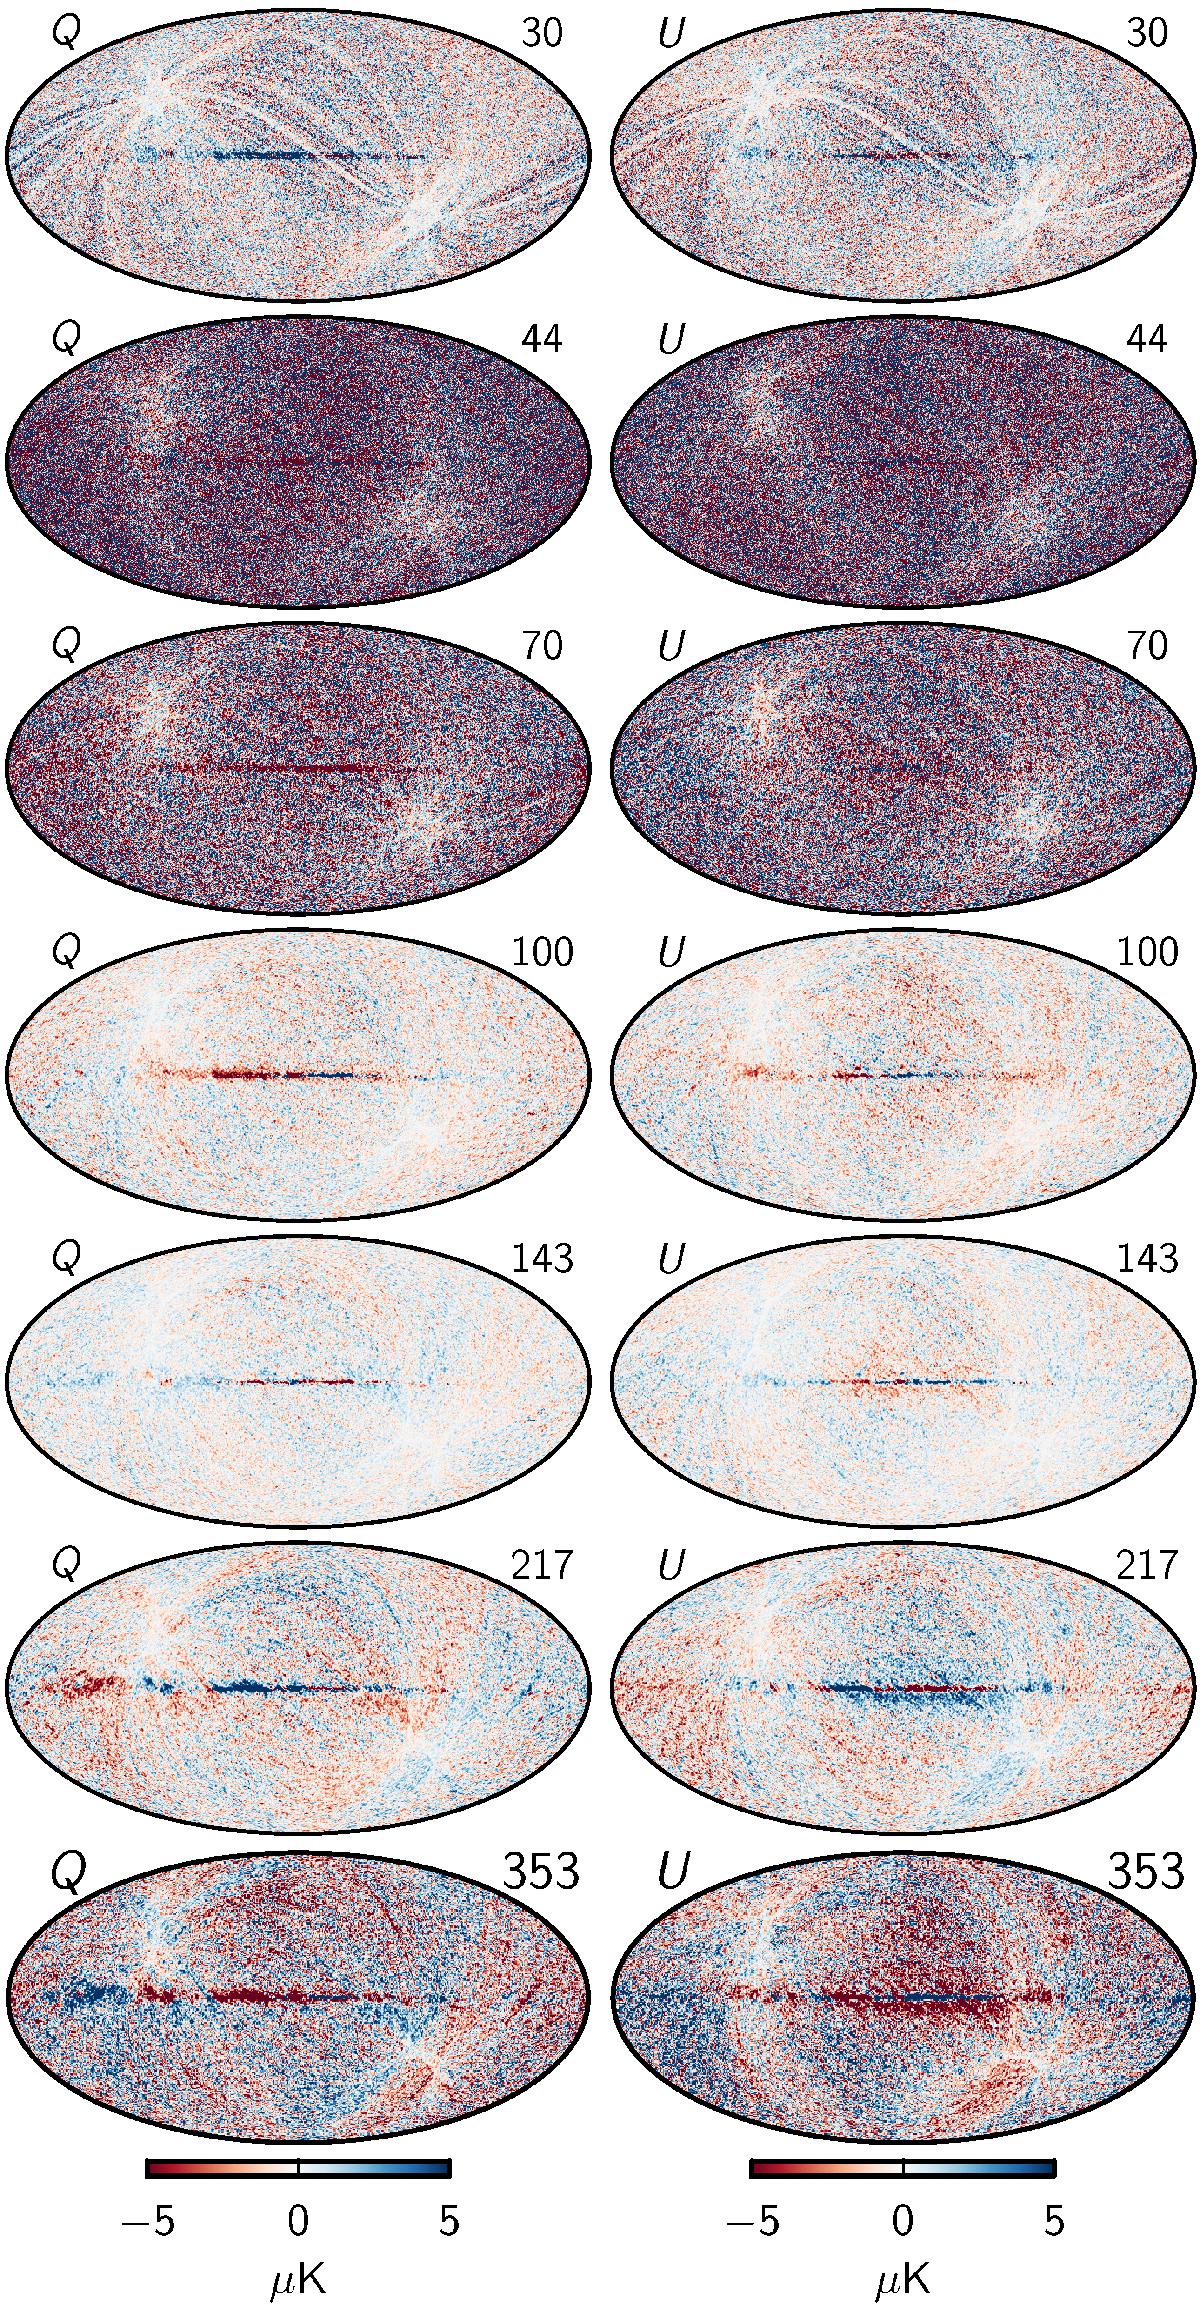
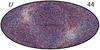
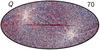
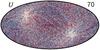
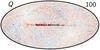
Polarization residual maps, dν−sν. Each row corresponds to one frequency map, with 30 GHz in the top row and 353 GHz in the bottom row; left and right columns show the Stokes Q and U parameters, respectively. All panels employ the same linear colour scale.
This figure is made of several images, please see below:
Current usage metrics show cumulative count of Article Views (full-text article views including HTML views, PDF and ePub downloads, according to the available data) and Abstracts Views on Vision4Press platform.
Data correspond to usage on the plateform after 2015. The current usage metrics is available 48-96 hours after online publication and is updated daily on week days.
Initial download of the metrics may take a while.