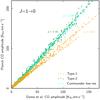
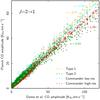
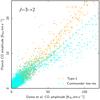
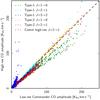
Fig. 33

T–T scatter plots between Type-1, Type-2, Commander CO maps and the Dame et al. (2001) CO J = 1 → 0 map, smoothed to 1deg FWHM and pixelized with a HEALPix resolution parameter Nside = 64. The panels show correlations for J = 1 → 0 (top left), J = 2 → 1 (top right) and J = 3 → 2 (bottom left) line maps; the bottom right panel show correlations between the baseline 1deg FWHM Commander CO maps and the (smoothed) Type-1, Type-2 and the high-resolution Commander J = 2 → 1 map.
Current usage metrics show cumulative count of Article Views (full-text article views including HTML views, PDF and ePub downloads, according to the available data) and Abstracts Views on Vision4Press platform.
Data correspond to usage on the plateform after 2015. The current usage metrics is available 48-96 hours after online publication and is updated daily on week days.
Initial download of the metrics may take a while.