Free Access
Fig. 11
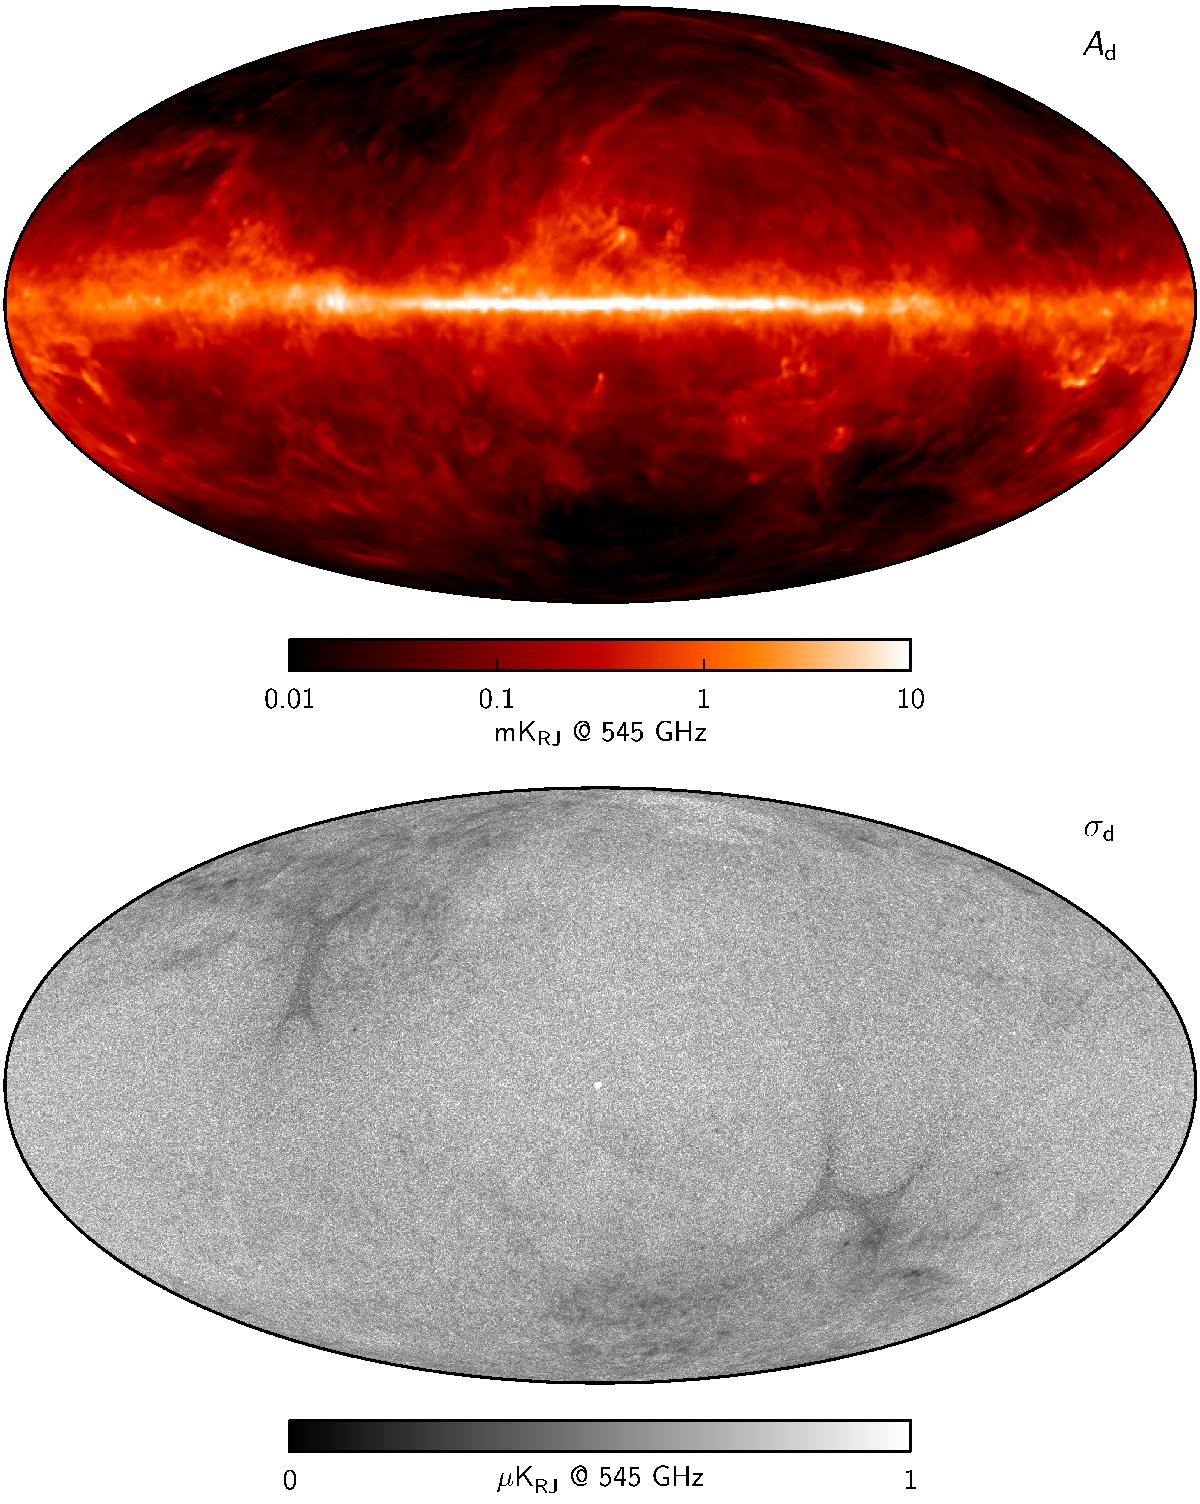
Maximum posterior (top) and posterior rms (bottom) thermal dust intensity maps derived from the joint baseline analysis of Planck, WMAP, and 408 MHz observations. The top panel employs a non-linear high dynamic range colour scale, while the bottom panel employs a regular linear colour scale.
This figure is made of several images, please see below:
Current usage metrics show cumulative count of Article Views (full-text article views including HTML views, PDF and ePub downloads, according to the available data) and Abstracts Views on Vision4Press platform.
Data correspond to usage on the plateform after 2015. The current usage metrics is available 48-96 hours after online publication and is updated daily on week days.
Initial download of the metrics may take a while.