Fig. E.5
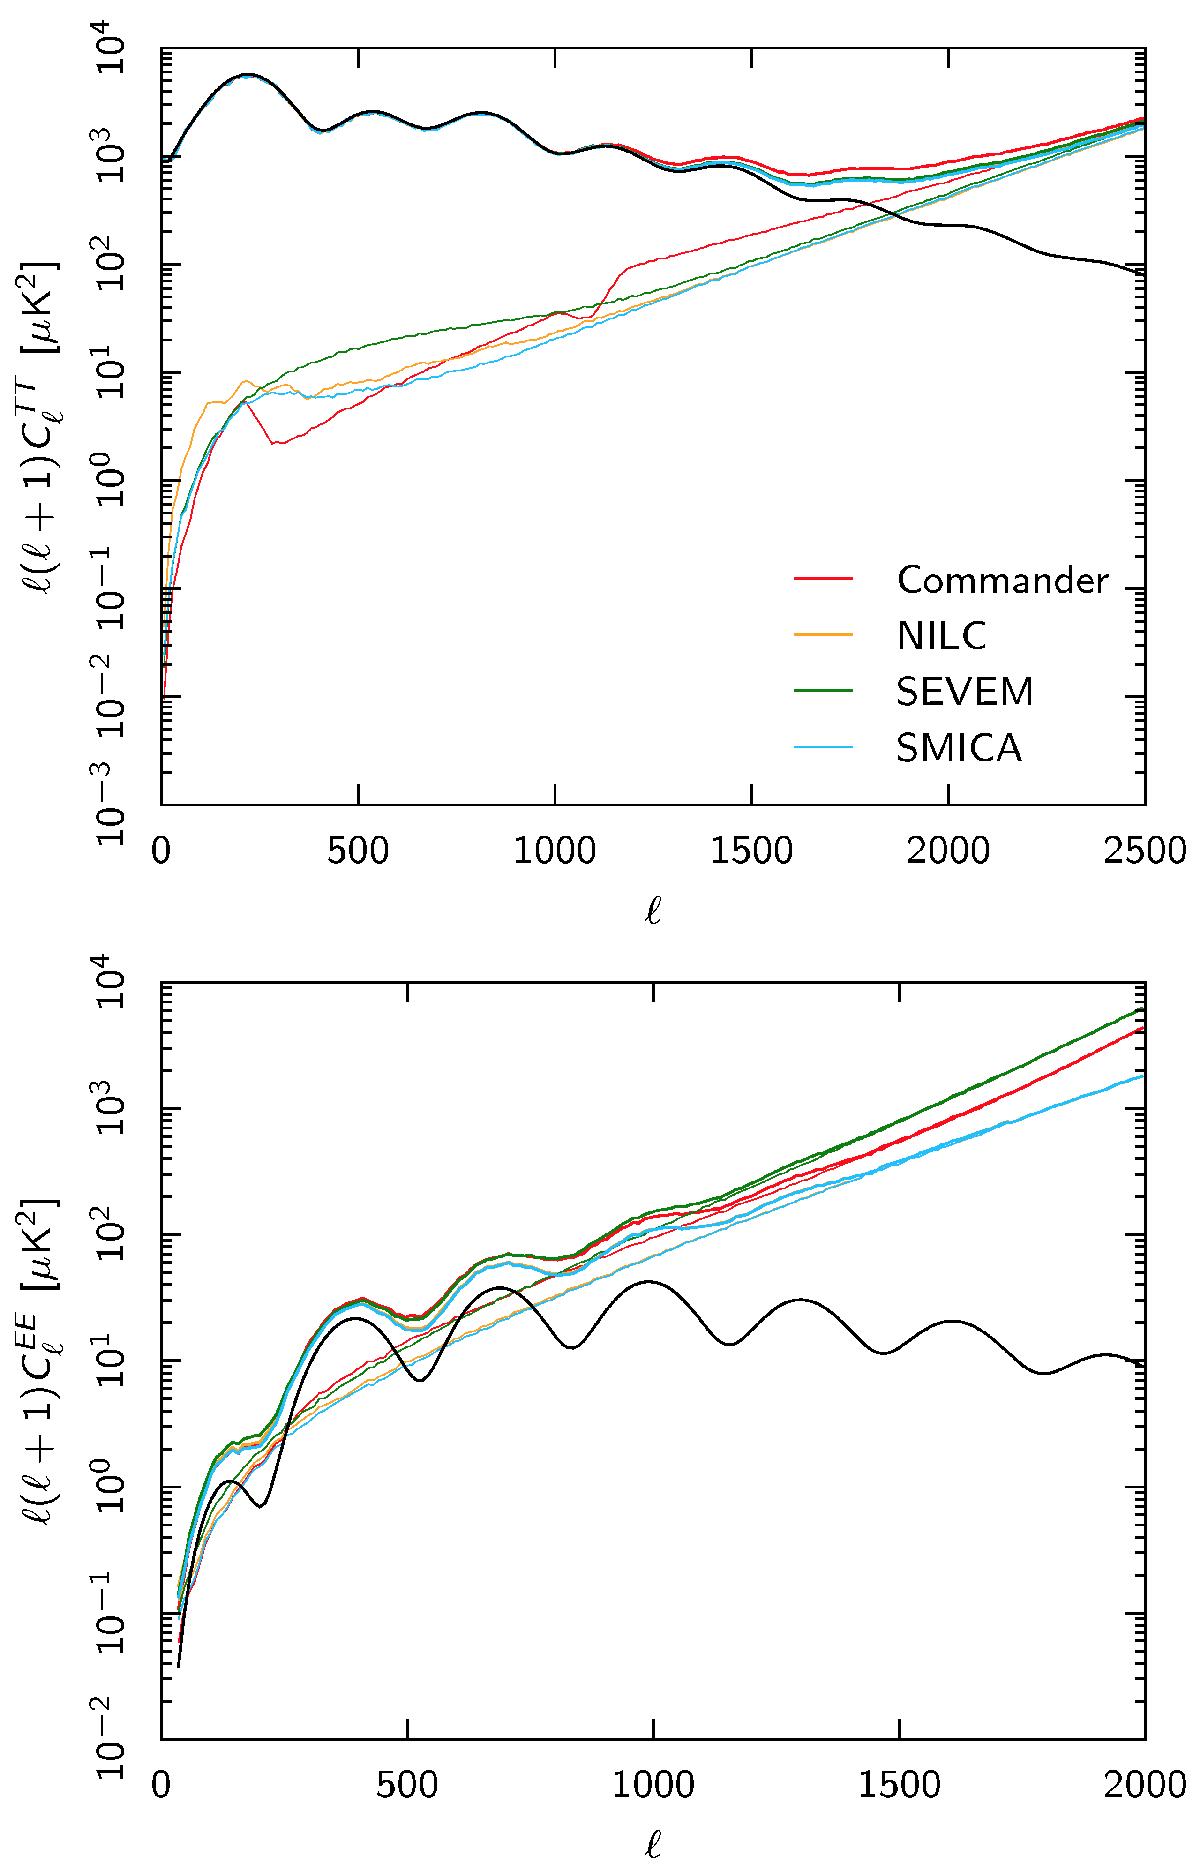
Power spectra of the foreground-cleaned CMB maps from FFP8 simulations. Top: TT power spectra evaluated using the FFP8-UT74 mask. Bottom: EE power spectra evaluated using the FFP8-UP76 mask. Thick lines show the spectra of signal plus noise estimated from the half-mission half-sum maps; thin lines show the noise levels from half-mission half-difference maps. The black line shows the input spectrum.
Current usage metrics show cumulative count of Article Views (full-text article views including HTML views, PDF and ePub downloads, according to the available data) and Abstracts Views on Vision4Press platform.
Data correspond to usage on the plateform after 2015. The current usage metrics is available 48-96 hours after online publication and is updated daily on week days.
Initial download of the metrics may take a while.