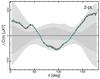
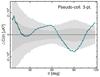
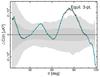
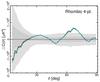
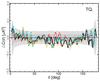
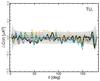
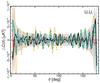
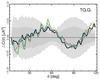
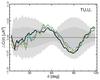
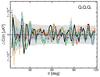
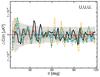
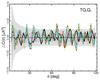
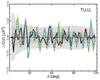
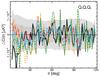
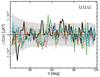
Fig. E.4
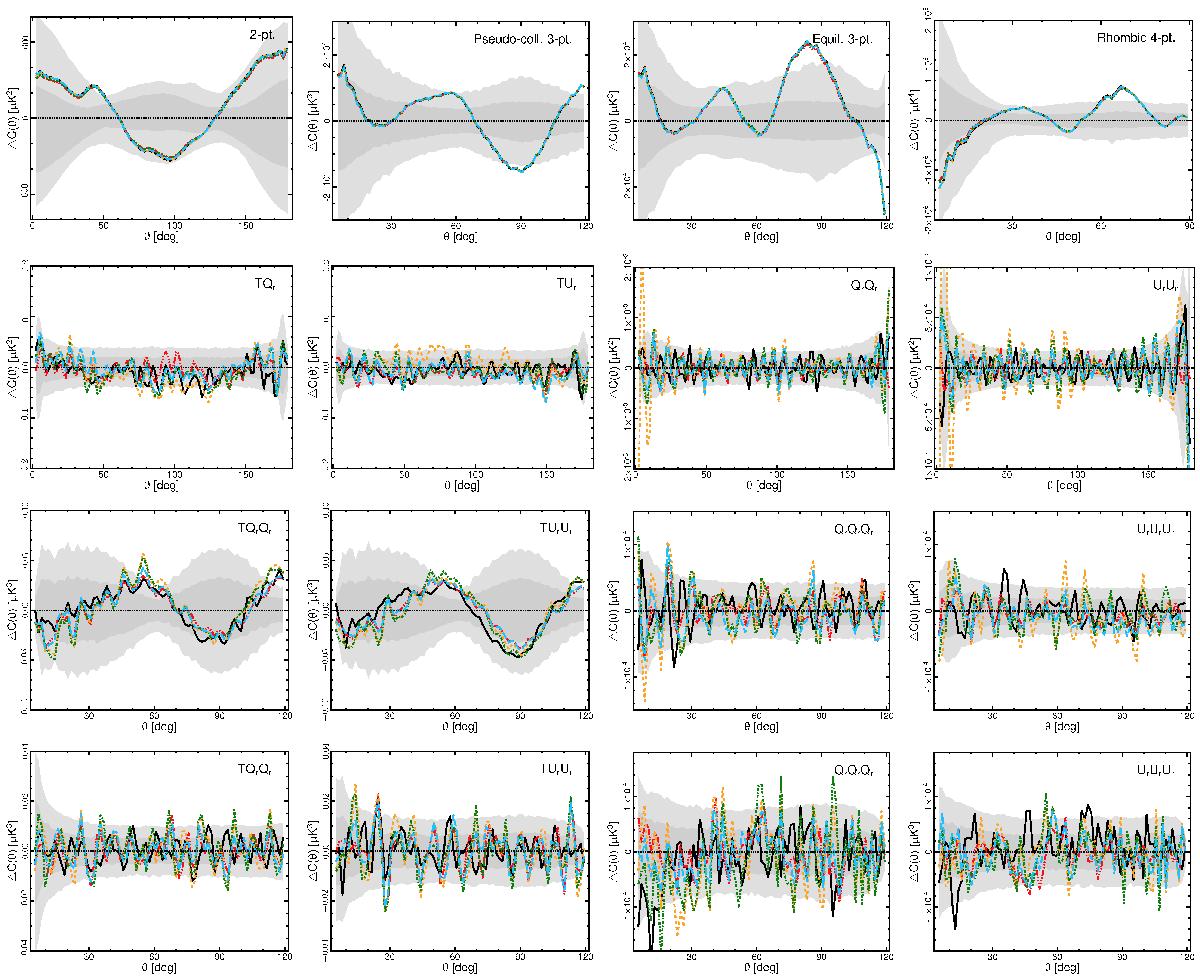
Difference between the N-point functions for the high-pass filtered Nside = 64 FFP8 CMB estimates and the corresponding means estimated from 1000 MC simulations. The Stokes parameters Qr and Ur were locally rotated so that the correlation functions are independent of coordinate frame. The first row shows results for the temperature map, from left to right, results for the 2-point, pseudo-collapsed 3-point, equilateral 3-point and connected rhombic 4-point functions. We note that the lines lie on top of each other. The second row shows results for the 2-point function, from left to right, TQr, TUr, QrQr, and UrUr. The third row shows results for the pseudo-collapsed 3-point function, from left to right, TQrQr, TUrUr, QrQrQr, and UrUrUr, and the fourth row shows results for the equilateral 3-point function, from left to right, TQrQr, TUrUr, QrQrQr, and UrUrUr. The black solid, red triple-dot-dashed, orange dashed, green dot-dashed, and blue long dashed lines correspond to the true, Commander, NILC, SEVEM, and SMICA maps, respectively. The true CMB map was analysed with added noise corresponding to the SMICA component separation method. The shaded dark and light grey regions indicate the 68% and 95% confidence regions, respectively, estimated using SMICA simulations. See Sect. 7.2 for the definition of the separation angle θ.

Current usage metrics show cumulative count of Article Views (full-text article views including HTML views, PDF and ePub downloads, according to the available data) and Abstracts Views on Vision4Press platform.
Data correspond to usage on the plateform after 2015. The current usage metrics is available 48-96 hours after online publication and is updated daily on week days.
Initial download of the metrics may take a while.